- Fixed Price Option in which company fixes the issue price.
- Book building method, in which company fixes the floor price and the price range for bidding by investors. The investors need to bid for equity shares between the range fixed by the company.
The difference between the two, apart from price is that the demand for the security can be known every day in case of book building whereas in fixed price option it can be estimated only after the issue closes. The allotment price will be initimated to the investor after allocation of shares.
A company can issue IPO’s either by fixed price option or book building method or a combination of both. Now a days book building is more common.
When an investor applies for an IPO, he reads the offer document and if satisfied with its contents, risk disclosure etc. he proceeds further with the application process.
However, after the stock gets listed in the exchange and trading begins, we find that funny things start happening. Obviously no price volume data will be available before the stock gets listed, and as trading goes on, the technical analyst will be able to understand the price action.
Before one invests in IPO, he has to realize this fact and it is one of the market risks. Companies with good fundamentals and decent corporate results have struggled in the stock market.
Let us study each case with an illustration.
Educomp Solutions Limited:
Issue price was Rs.125. The stock has skyrocketed to Rs.1880 as on 28.05.2007. So, the investor has gained about 15 times in 16 months time. Nice thing, if one had the vision to anticipate such price.
Let us examine the weekly chart of EDUCOMP shown below.
Every rise was followed by a corrective decline or sideways movement as it can be seen in the chart. This is an indication of a healthy bull market.
This is an example of an ideal case where the bulls were in perfect control over the stock.
Jet Airways (India) Limited:
It was allotted at Rs.1100 per share 2 years ago. It has been struggling ever since it got listed. Nice airline with good financial results but in the stock market it is truly an underperformer. I have read reviews of Jet airways and they fly to South East Asia, Europe and USA (from August 2007) as well. Their service seems to be very good, I understand from the reviews. The net profit for the financial year 2005 – 2006 is about Rs.452 crores or Rs.4.52 billion. But let us see the weekly chart of jet airways for a while.
It continued to form lower highs and lower lows till about late July 2006. It fell from 1383 to 475. It was bullish till mid February this year and managed to close around 786. As can be seen from chart, it broke its support trendline and reached another low. Stock seems to be bearish and it is quite possible that further lows may be reached. Unless it closes above 805 which will be horizontal resistance line one should not expect much from this stock.
Bombay Rayon Fashions Limited:
Issue price was Rs.70. Textile stocks have been witnessing a steep fall these days but this one is attempting to test its previous high.
It was almost non stop rise from 80 to 258.60 followed by a downtrend to a low of 102.50. It managed to break its previous high and touched a high of 275.50 during the next uptrend. But since its support trendline has been broken, it may face strong resistance at its previous high.
This is a remarkable stock considering the bearish trend among popular textile stocks like Arvind Mill, Alok Textiles, Bombay Dyeing, Raymond etc.
JHS Svendgaard Laboratories Limited
The stock was allotted for Rs.58. But it was continuously bearish and reached a low of 27.50. Currently it is bullish and a close above 43.20 is likely to take this stock further up.
There is nothing wrong with this stock technically. Uniform price volume pattern can be seen in case of both uptrend as well as downtrend. It has closed above its resistance trendline. One will have to wait and see whether it closes above its horizontal resistance line at 43.20.
Reliance Petroleum Limited
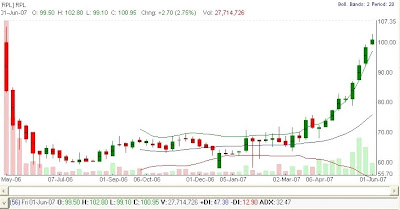
Issue price was Rs.60. The stock touched a high of 105 in the listed week but there was not much of activity for the next 10 or 11 months. It turned bullish in late March this year and very likely to test its previous high soon. Its previous low of 58.05 has not yet been broken, though it did come close to it at 58.10. The chart looks like a bowl – very unique.
Shree Renuka Sugars Limited
It was issued for Rs.285. After that it skyrocketed to 1665 and fallen again all the way to 260.10. This again is unique – all this happened in about 18 months or so. Though currently bullish, because of the absence of clear waves, it is likely to face resistance around 917. One of the few sugar stocks the crowd is interested when many others are on a downtrend.
Conclusion:
Investing in IPO’s has its own potential risks and rewards. Some are runaway successes whereas some others have miserably failed. So, before you put your money in IPO please be aware of this fact. Each stock does behave differently but understanding what IPO and how it fares in secondary market will make the investor little more knowledgeable.


