The most common method used by technical traders to enter ‘long’ positions i.e. (buy first and sell later) is ‘buy on resistance breakout’. We had picked several stocks in my earlier articles based on breakouts. But the risk associated with this method is that the stock can retrace back to support levels. After a correction traders can identify a possible reversal at support level and it can be used to initiate a trade.
The reversals discussed below are based on “Three inside up” candlestick patterns. There have been few theories that candlestick patterns work well in some markets better than others. But, when identified properly and applied correctly, these can be found to work in any financial market. The Japanese have strong belief that candlestick charting is a very powerful analytical technique. I have always used candlesticks in my analysis.
Bombay Dyeing & Manufacturing Company Limited:
Bombay Dyeing belongs to the well known Wadia group. They have diversified businesses in textiles, chemicals, aviation, food and health care industries. The company was established in 1879. Cotton spun yarn dyeing was then carried out manually. Today, this company exports more than 50% of its production to USA, UK, Germany etc. It has presence in all the major continents. The company’s net profits were worth Rs.36 crores in 2006 – 07.
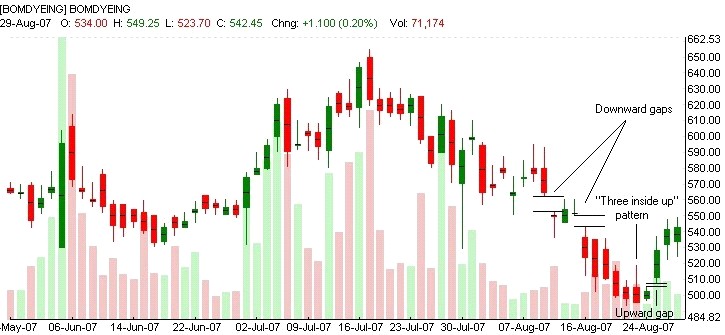
In the daily chart shown above, the two downward “gaps” can be noticed. It simply means that there was more supply than demand on those sessions. But invariably, these gaps get closed when the stock reverses. A “Three inside up” pattern i.e. “Harami” pattern followed by a higher close and green candle has been formed. Note the upward gap on the third day. 61.8% retracement works out to be 593.
GTL Infrastructure Limited:
GTL Infrastructure provides necessary infrastructure for mobile phone operators. The entire package includes ground based/roof top towers, microwave racks, cable racks, electrical accessories etc.

The tower packages are owned by GTL Infrastructure while operators pay monthly or quarterly for using the facilities. The company declared a net profit of Rs.10 crores for the quarter ended June 2007.
A “Three inside up” pattern has been formed in the daily chart of the stock near support level on August 27. The previous high at 38.55 is the first target for the stock during the pull back rally. The technical target is 40.40 which is 61.8% retracement.
Kotak Mahindra Bank Limited:
We discussed about this stock in my previous article, “Hot or Not? Private sector banks on a roll!”. Kotak Mahindra Bank offers total financial solutions to customers, from personal/corporate banking, stock broking, life insurance, investment banking, loans etc. Mahindra & Mahindra have a stake in the bank.
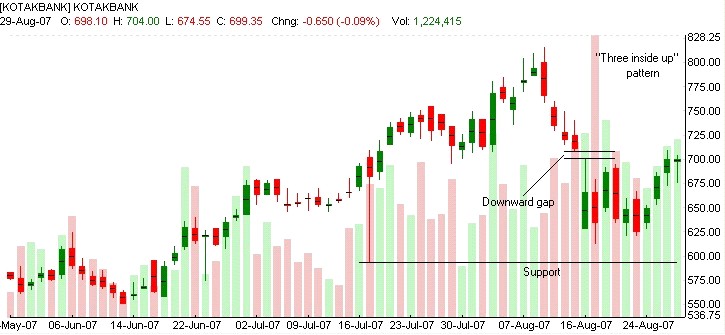
Again, a “Three inside up” pattern has been formed in the daily chart. The previously formed downward gap temporarily acts as minor resistance for the stock. A close above 714 would mean that the 50% retracement is achieved and also the resistance would be broken. Once it happens the stock should be able to test its previous high at 815.
It is important to note that the formation of candlestick patterns in areas other than support or resistance levels may not really reflect a reversal. Hence the first task in deciding whether to enter a trade based on candlestick patterns is to identify support and resistance levels.
Shipping Corporation of India Limited:
The Government of India has about 80% stake in this company. For more than 40 years, SCI owns and operates 35% of Indian tonnage and it has diversified in nearly all areas of shipping business serving both national and international trades. It is the only Indian shipping company operating break bulk service, international container service, liquid / dry bulk service, offshore service, passenger service etc. It also monitors a large number of vessels on behalf of various government departments and organizations. Its net profits were Rs.1014 crores for the financial year 2006 – 07.

In this stock too, a “Three inside up” pattern has been formed. There are a couple of gaps in the chart, on August 6 and August 10. However they are very minor (less than 0.50% of close price) and may be ignored. 61.8% retracement works out to 207 and this is the technical target for the current pull back rally.
Sunil Hi-Tech Engineers Limited:
Sunil Hi-Tech Engineers Limited is engaged in the fabrication, erection / testing and commissioning of bunkers, boilers, fuel oil systems etc. in the power sector.
It reported a net profit of Rs.7.60 crores during the financial year 2006 – 07.

The stock has more than doubled in the last 3 months. It has not fallen much during the recent correction. In this stock also, a “Three inside up” pattern has been formed. The support trendlines are intact; an indication that the stock is still bullish. On the second day of the candlestick pattern, a “doji” body as been formed. This has more significance, since a harami cross pattern is more reliable than a harami pattern. The stock is likely to test its previous high at 234.90.