Adani Enterprises Limited:
Yet another classic example of a “cup and handle” breakout. During the first week of December 2004 this stock made a high of 85.45. It consolidated for 18 months. Eventually it broke its previous high in the first week of May 2006 and touched a high of 199.10. The cup and handle pattern usually takes long time to form; it is a bullish continuation pattern. The height of the ‘cup’ on the two sides need not be equal. In this case, though the stock had broken the previous high in November 2006, it didn’t move up further much. That can be attributed to the fact that during the first corrective decline after the long uptrend, it broke its 61.8% retracement but immediately bounced back. The next upmove was too short; the following corrective decline again was not a major one. So, the ‘handle’ formation has taken some 7 months now. This stock has broken the major resistance level of 255.70 this week. The next target for the stock is 310 and medium term target is around 380. There should be a substantial increase in volume on the breakout above the handle's resistance. In this case, the volume has gone up by 2.75 times this week. This is also a confirmation of the breakout.
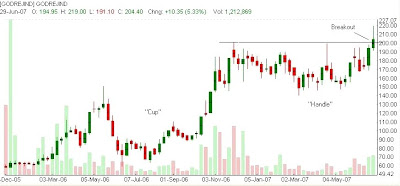
Godrej Industries Limited:
One more example of the cup and handle break out. The cup, as I mentioned above, forms as the prices reach almost the bottom of the previous uptrend. In an ideal bull market, 61.8% should be considered as a support during a downtrend. If this level is breached, the stock takes long time to consolidate and over come the selling pressure. That can be seen here. The ‘cup’ formation had taken 29 weeks whereas the ‘handle’ has been formed in 29 weeks. Together it has taken about 15 months! Now since the resistance has been broken, the stock can be expected to reach target of 280.
Hikal Limited:
This stock too, has seen some consolidation phase. It has just broken the previous resistance of 442.95 made during the first week of November 2006. So almost 8 months of consolidation pattern has been successfully broken out. It should be remembered that huge rises follow long periods of sideways movment or consolidation pattern, as we disucssed in the case of Adani Enterprises Limited above. Targets for this stock are 539 and 665.
Tin Plate Company of India Limited:
This stock had fallen from a high of 106.70 in the last week of April 2006 to a low of 40.10 in mid March 2007. (Once again we remind here: Overall index has been bullish; not all the individual stocks! We have so far seen several cases like this.) It had broken out 3 weeks ago. Once again fell below the previous resistance. However, for the last two weeks it has closed above the resistance line. Watch the support trendline. The lows have so far not breached. Since wave 1 has been short, we can expect wave 3 to be reasonably long. The next resistance is at 72. Once this level is breached we can think of targets around 81.
XL Telecom Limited:
It is relatively a new stock since it got listed in December last year. After hitting a high of 216 in February this year, it fell to a low of 93.60 in March. The first wave’s high of 131.50, (which was the resistance) has been broken this week and the stock has managed to close at 134.25. It can be seen from the chart that 50% retracement works out to 154.75; some resistance will come around this level. 61.8% retracement is 169.18 or around 169 should be the target for this stock. The prices had fallen down consistenly along with volumes soon it got listed (except for one week). If higher highs and higher lows were formed this could have been an excellent signal; but in this case the previous low was broken and so it cannot be regarded so.


