Here let us discuss about few stocks which look technically interesting from a long term perspective.
Dena Bank:
We discussed in my earlier article, “Chart Patterns and market’s reaction” about bullish and bearish patterns. Here’s another, called triple tops. This is a bearish indication. But when the triple top formation is successfully broken out, it becomes an excellent opportunity to enter the stock. Usually it is said, “Never buy a stock unless it breaks the resistance; Never sell a stock unless it breaks the support.” As displayed in the above chart, watch the triple top formation since 30.06.04. It has taken three full years to break this pattern. Big movements take considerably long time. The stock tried to break the resistance on two occasions but failed. Last month, it broke the resistance with highest volumes (see the chart). This month too, it has closed above it. The stock looks very interesting from a long term view. From a low of 4.60 in September 2001 it has gone upto a high of 50.80 or got appreciated nearly 11 times. From the current levels, one can expect a gain of around 100% to 200% within a two or three years.
GTL Limited:
In the year 2001, the stock had fallen from a high of 873.65 in January to a low of 47.55 in September. It has been consolidating since then.
Watch the 66 month consolidation pattern between October 2001 and March 2007 in the chart displayed above. In April this year, stock had successfully broken this pattern. Between 2002 and now, the index has already appreciated more than 4 times. Read my earlier article “Indian stock market – an outlook” for more details. This stock has not “participated” at all in the current bull run i.e. the market participants have shown little interest in this stock. Now, if we consider a retracement of 50% it works out to around 460. In other words, we can expect this stock to double in the next few years.
GVK Power and Infrastructure Limited:
Yet another case of a triangle breakout. This stock too had a reasonable fall in the past, from a high of 388 in February 2006 to a low of 130.80 in July 2006. Last month it had broken out with a triangle height of about 257 rupees. When this is added to its previous high of 388 it gives a target of 645 rupees. But for the short term we may expect some decline since there has not been a significant correction from its low of 130.80. These corrections should be good opportunities to enter the stock for long term.
Reliance Petroleum Limited:
We have already discussed this stock in my earlier article “How do IPOs fare in secondary market?”. I had mentioned that the stock had formed a “bowl” shaped pattern in weekly charts. Same is the case in monthly charts too. We may think of this as the “cup” portion. We will have to wait for the “handle” to form, which may take few months time.
Within 2 months of listing the stock had fallen from a high of 105 to a low of 58.05. But it has bounced back and closed above the resistance this month. Since it has retraced more than 100%, one may watch this stock for declines. As we have seen from my earlier articles that cup and handle breakout is a bullish continuation pattern, it is necessary to observe whether this is formed at all. The next step will be confirmation of the breakout.
SREI Infrastructure Finance Ltd:
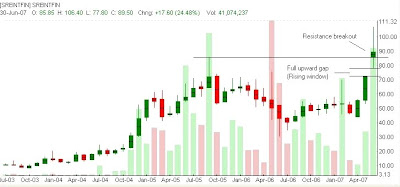
This stock has been consolidating since October 2005. It has formed a “rising window” this month while breaking out. Watch the full upward gap or the rising window in the chart. This indicates a strong demand for the stock. It is currently on its 3rd wave in monthly chart. Even if it declines, the “gap” should act as a strong support for the stock. In the long term, it may touch 180 or double from the current price levels. Technically it looks very good with the upward gap formation.


