Everest Industries Limited:
Nearly a 3 month consolidation pattern ultimately came to end on 02.07.07. The stock’s first wave retraced from 81.05 to 119.55 (gain of almost 48%). This was consolidating since 09.04.07. Watch the ‘long white candle’ on 12.06.07 on the chart.
The 3 months consolidation is good enough for both short and medium term. The long white candle’s low shows a valiant attempt by the bears to break the pattern. However they didn’t succeed. Now the stock has broken out its resistance. The next resistances for the stock are 142 and 150.95.
Indian Bank:
This is a recently listed public sector bank stock. It has crossed its previous high of 135 today, with volumes and a “rising window” or “upward gap”. We have discussed about this rising window in 5 Great Long Term India Stock Buys (SRE Infrastructure Finance Limited). As I mentioned in these articles, huge demand for the stock can be confirmed by both gap and increasing volumes.
The short term targets for the stock are 159 and 172.
Polyplex Corporation Limited:
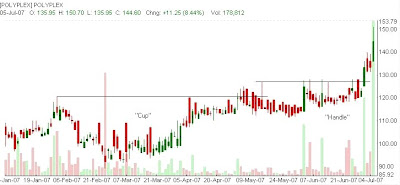
Another good example of “cup and handle breakout”, a bullish continuation pattern. The cup formation took about 9 weeks; the handle formation has taken about 12 weeks. Watch the consolidation since 09.04.07. This is what an ideal chartist will look for: breakout from consolidation pattern.
On 02.07.07 the resistance has been broken by the stock (watch the volume on the chart). The stock has gained about 8% today. Corrective declines, if any, will be a good opportunity to enter the stock. This looks good in medium charts too. We can expect a target of around 178. As I have mentioned in my earlier articles, the chart patterns, when identified correctly, give immense opportunities to profit.
Sintex Industries Limited:
This stock is currently in its 5th wave in daily charts. Watch the resistance breakouts in the chart below. Since the wave 1, wave 3 are relatively smaller, we can expect the wave 5 to be relatively bigger. Interestingly, the stock is not far away from its previous high of 263.20. Once this level is breached we can expect the stock to move up further. On 02.07.07 it registered a high of 285.45; However it has not yet closed above its previous high of 263.20 made on 27.11.2006.
SRF Limited:
Watch the similarities between this stock and Everest Industries Limited discussed above.
In both stocks one may find the long white candlestick. An attempt by the bears that failed to pull prices down.
This stock made a high of 372.70 in first week of April 2006. Now it is traded at nearly half that price. (Yet another example of a stock going down by 50% when the overall index keeps making record highs.) The first wave was very short; the third was reasonably long. The fourth has been a consolidation pattern for a little more than 2 months. Now that the stock has broken out yesterday with volumes, the fifth wave has just started. We can expect targets around 222 for the short term.


