- DLF Limited
- Housing Development and Infrastructure Limited
- IVR Prime Urban Developers Limited
- Omaxe Limited
- Puravankara Projects Limited
These stocks have been listed and we had discussed in my previous article, “How do IPO’s fare in Secondary Market?” about how IPO stocks are received by the market particpants. Some stocks perform exceptionally well and some others get discarded by the crowd.
In this article, let us discuss the short term perspective of the five stocks mentioned above using daily charts.
Summary:
| Scrip | IPO Price | Price 05-Oct | % return |
| DLF | 525 | 851.10 | 62.11 |
| HDIL | 500 | 722.20 | 44.44 |
| IVRPRIME | 550 | 441.30 | (19.76) |
| OMAXE | 310 | 317.40 | 2.39 |
| PURVA | 400 | 460.45 | 15.11 |
We indicated that IVR Prime might be avoided in the short term. It may be noted that Puravankara had extended the IPO subscription period by five days and also reduced the price band from 500 – 525 to 400 – 450 per share. This happened at a time when the “US Sub-prime mortgage crisis” was being cited as the reason for stock market collapse.
The following table gives the BSE Group/Scrip codes for the stocks.
| NSE Symbol | BSE Group | Scrip Code |
| DLF | A | 532868 |
| HDIL | A | 532873 |
| IVRPRIME | A | 532881 |
| OMAXE | A | 532880 |
| PURVA | A | 532891 |
DLF:
The stock got listed on July 5. On August 13, it touched a low of 490, 35 less than its IPO price (See chart below).

The long lower shadow when it broke the support indicates that there was lot of buying support at lower levels. Technically, it broke its short term resistance on September 19 with an upward gap. On October 3, it managed to touch a high of 904, gaining 16.38%. If we consider 100% retracement from the low of 490, the target for this upmove works out to 980.
On October 3, the BSE had made an announcement that “the Company has been awarded the project to develop a ‘New Bangalore City’ in Bidadi following a global tender issued by Bangalore Metropolitan Regional Development Authority (BMRDA). The project shall generate value in excess of Rs. 50,000 crore (USD 12.5 billion), which is the single largest investment in real estate in India.”
It may be noted that the ‘news’ arrived in the marketplace nearly two weeks after it had broken its resistance. This is a good example of how the stock market works.
HDIL:
This stock too, had gone below its IPO price of Rs.500 on August 6 after getting listed on July 24. Interesting to note that it touched a high of 634.30 on July 26.

The stock recorded a low of 477.50 on August 22. At the time of the so called US Sub-prime mortgage crisis, this stock closed below its IPO price on 4 occasions – only to bounce back. Similar to DLF, the stock had broken its resistance on September 19 with an upward gap.
A bullish “harami” candlestick pattern was formed on September 26. On October 4, the stock had closed at 707.15, gaining 6.42%. There seems to be some more upside left, as the technical target from the low of 477.50 works out to be 773.
IVR Prime:
We gave the following reasons for avoiding the IPO in the short term.
- Issue was slightly overpriced compared to others.
- Except the Gachibowli project in Hyderabad, IVR Prime has not executed any other project; others are in planning stage.
- The company owns only 14% of its projected 2,478 acres land bank.

On the day of listing i.e. August 16 the stock made a high of 495, 55 less than the IPO price. This is the critical resistance for the stock. On August 23 the stock made a low of 343. Though the stock closed above 425 on September 24, it registered a lower low of 358 on September 27. This violates the Elliot wave theory. Though 343 still remains intact, formation of a lower low during an uptrend indicates that a reversal is likely to follow.
Unless this stock closes above 495 with reasonably good volumes, one should not expect any upside from the stock. The market has endorsed The India Street’s view on the IPO.
Omaxe:
The stock opened at 410 on August 9 with a premium of Rs.100. It touched a high of 448 before closing at 349.35. However, it opened with a huge downward gap of 13.90 on August 16. On August 22 it touched a low of 263.15.

It can be seen from the above chart that wave 1 is complete and wave 2 is in progress. The stock faced resistance around 355.70 (50% retracement level) and it closed above it for 2 days in a row. With the current trend it has support at 304.10 which is 61.8% retracement level. The stock needs to break its resistance at 369.95 on a close basis in order to move upwards.
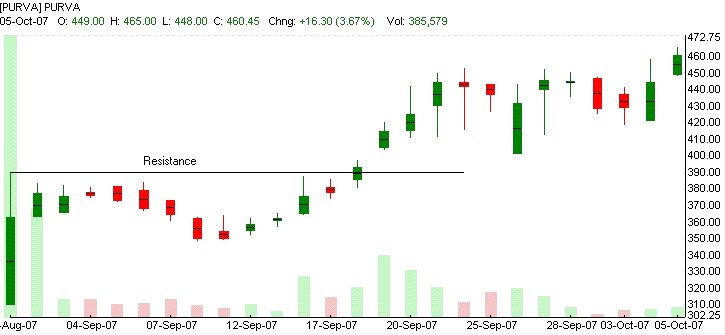
Puravankara Projects:
The stock opened with a negative premium of Rs.90 (IPO price: Rs.400) on August 30. It has been the lowest till today. After 13 trading sessions, it broke its previous high of 390 (made on day of listing) on September 18. On October 5 it closed above 452.50, a high made on September 24. The short term target works out to 501.60 when calculated from a low of 310.