We have seen in my earlier articles about stock prices moving up or down and possible technical reasons for such movements. Let us discuss them in detail.
Breakout from consolidation patterns:
“Consolidation” means the stock moves in a narrow price range (also called sideways movement) for a reasonable amount of time, say few months. During this period, the tussle between buyers and sellers is in equilibrium and once this is disturbed, a “breakout” occurs and prices go up or go down considerably, with good volumes (volume is simply the total number of shares traded in a specified period, i.e. a session, week or month.)
The following example illustrates an upward breakout.

Close price moved between 18.50 and 20 for almost a year before ‘breaking out’ on the upper side with volume. Within a short span of time stock gained nearly 250%. Similar pattern is valid for downside breakout too.
Breakout from chart patterns:
By chart patterns we mean formation of a geometrical figure such as a rectangle, triangle, wedge or special shapes such as cup and handle, flag, pennant, head and shoulder etc. These are formed over a period of time as price action continues. Some of the important bullish “reversal” patterns are double bottoms, triple bottoms, inverse head and shoulders; bearish reversal patterns are double tops, triple tops, head and shoulders. By reversal we mean the trend has changed from bullish to bearish or vice versa. Some of the bullish “continuation” patterns are ascending triangles, flags, cup and handle etc; bearish patterns include descending triangle, symmetrical triangles etc. By continuation we mean extension of the current uptrend or downtrend.
Following example describes a “double top” pattern.

There are 2 peaks in this pattern. First one registered a vey good volume when buying was at full swing. The second peak does not show similar volume which implies that the investors are not much interested in the stock. As a result, downtrend starts and stock breaks its support (a price at which buyers are expected to enter and push prices up). Once this happens, prices fall continuously due to lack of buying interest. This is a “bearish” pattern.
Candlestick patterns:
Candlesticks originated in Japan and are in use since 16th century. A candlestick pattern may consist of two, three or more candlesticks. Common examples are engulfing pattern, harami pattern etc. These can be visualized to be like eclipses. When formed during a corrective decline in an uptrend, these patterns offer trade opportunities, as sellers fade out and buyers enter the market.
In the example given below, a “red” candle (i.e. open price of the day is higher than close price) is engulfed (covered) by a “green” candle (i.e. close price is higher than day’s open price). This means that after a decline in price, at support levels buyers enter and extend buying support. This is usually confirmed by another green candle and higher trading volumes on the next day (see the chart).

Positive and Negative divergences:
These are considered to be signals of major shifts in price movement. A “positive” divergence occurs when a stock falls to a new low but a technical indicator such as MACD (moving average convergence divergence) makes a new high. A “negative” divergence occurs when stock makes a new high, but a technical indicator fails to achieve the same.
The chart displayed below shows an example of “negative” divergence.

Upward and Downward Gaps:
An upward gap occurs when today’s low is higher than yesterday’s high. A downward gap occurs when today’s high is lower than yesterday’s low. These gaps indicate strong demand for the stock when accompanied by good volumes.
Here’s a case of upward gap:

The stock gained more than 30% after the upward gap formation. Needless to mention that the upward gap formed in an uptrend has more significance than the one formed in downtrend.
Bull traps / bear traps:
These are special situations in which the stock may break its resistance to form a new uptrend; but due to lack of buying support it may fall again to original levels. Bear traps are formed when a stock breaks its previous low but instead of going down further, the prices move up as a result of aggressive buying. These do not occur every time resistances or supports are broken.

In the above chart, the support was broken on June 7 this year. Instead of more sellers coming in, buying started vigorously and the stock nearly doubled. But during the corrective decline no major support was available and it came down to its previous resistance levels.
Technical rallies due to overbought and oversold conditions:
Stock prices move up and down endlessly. Once an ‘overbought’ or a saturated condition is reached, sellers enter to book profits. As a result prices fall to their support levels. In case of oversold conditions, buyers enter to take new positions. These are technical rallies, which usually occur at critical retracement levels of 38.2% and 61.8% retracements.

In the chart shown above, the stock had closed below its 61.8% retracement level which is a critical support. The bulls immediately pushed up the prices above its previous high. This is a case of a technical rally.
Over manipulations:
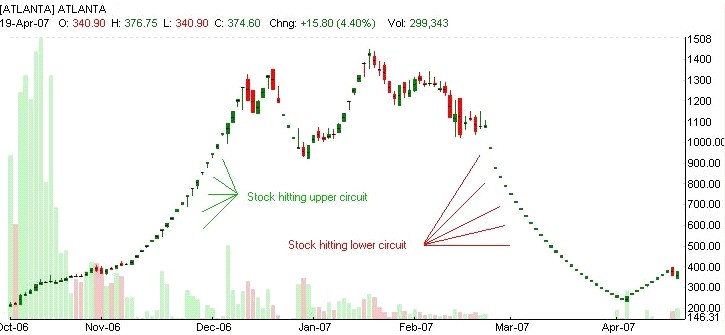
We do know that stock prices are determined by the market participants. But in some cases, we find only buying or sometimes only selling. In other words, once a stock begins to trade it hits the upper circuit or lower circuit. This can be considered as a case of “over manipulation” and usually occurs in low volume, illiquid stocks. In high volume stocks invariably intra day trading takes place. So the possibility of occurrence of “freezes” is minimal.

Watch how many days the stock has hit upper freezes during its first uptrend. During the downtrend, it does exactly the reverse – leaving sellers stranded. This could be regarded as a one sided price movement for most of the time.
Uniform price volume action:
In an healthy uptrend, increase in volumes is accompanied by increasing prices and during a pull back volumes dry up as prices decline. This is reversed in a downtrend, as volumes increase while prices decrease and during a pull back volumes decrease as prices increase. Following example depicts this action.

Uniform price volume action can be seen in the above chart. During uptrend prices rise and so are volumes; during a downtrend prices drop and so are the volumes. This is an indication of a ‘normal’ uptrend. However, it does not occur in all the stocks all the time.
Dead cat bounce or fall:
The term dead cat bounce means that the stock has staged a smart recovery or moderate gain after a steep fall. The same thing can be considered for a fall too. After gaining moderately the stock can fall heavily. These occur due to technical reasons such as coveing up short or long positions. If the stock falls back to its original level after the recovery it is a bounce. Otherwise, it could be a new bottom.

In the above example it can be seen that the stock rallied signficantly for a few days only to decline again and reach further lows. This type of a rally should be used only to exit the stocks.