Showing posts with label SHIPPING CORPORATION OF INDIA. Show all posts

Wednesday, September 12, 2007

Hot or Not? Shipping companies sailing smoothly!

Introduction:

With the advent of civil aviation, the contribution of the shipping companies in passenger transport has become negligible. For example, about 1,200 passengers travelled from Chennai Sea Port to Port Blair (Andaman & Nicobar Islands) every week in the year 2004. This is very negligible when compared to rail transport or air transport. However, shipping companies carry heavy cargo, including dangerous and inflammable liquids like crude oil. This is not possible by air transport.

In our previous “Hot or Not?” articles we discussed about Indian automobile and aviation stocks. In this article let us discuss about shipping companies.

Listed companies in India:

At NSE, following shipping companies are listed:

  • ABG Shipyard
  • Bharti Shipyard
  • Great Eastern Shipping
  • Great Offshore
  • Mercator Linings
  • Shipping Corporation of India
  • Shreyas Shipping & Logistics
  • South East Asia Marine & Construction
  • Varun Shipping

Of these, Mercator Linings belongs to ‘S’ group of BSE; Shreyas Shipping belongs to ‘B2’ group. We discuss the rest of the stocks.

Great Eastern Shipping’s offshore business was demerged in 2006 and Great Offshore was formed. Accordingly, for every 5 shares of GE Shipping held on record date, 1 share of Great Offshore was allotted. This was done by deducting Rs.2 from face value of Rs.10 of GE shipping. 5 shares of Great Offshore with face value Rs.2 were consolidated to form 1 share of face value Rs.10; similarly 5 shares of GE shipping with face value of Rs.8 were consolidated to form 4 shares of face value Rs.10.

Because of this demerger, GE Shipping was relisted in November 2006.

The following table lists percentage loss these stocks witnessed during the huge correction in May and June 2006.

Scrip

% fall May ‘06

% fall June ‘06

BHARTISHIP

22.87

17.30

SCI

13.93

0.15

SEAMECLTD

1.37

25.46

VARUNSHIP

0.24

16.53

NIFTY

13.68

1.86

It can be seen that, except Bharati Shipyard, the other companies did not lose much compared to Nifty in May 2006.

After the correction, the stocks have gained reasonably, as shown in the following table:

Scrip

3 month % gain

6 month % gain

ABGSHIP

45.17

67.01

BHARTISHIP

15.84

59.55

GESHIP

14.30

69.92

GTOFFSHORE

8.44

69.37

SCI

0.53

24.76

SEAMECLTD

17.85

25.45

VARUNSHIP

17.71

20.67

NONE of the shipping stocks returned negative results in the last 6 months.

Bharti Shipyard:

Bharati Shipyard’s monthly chart shows that the stock had completed its 2nd wave (corrective decline). It is still bullish for the long term, as can be seen below.

This stock went up from a low of 108.80 to a high of 528 or or by 485%. After a year’s consolidation, it has broken out in July 2007, but without much volumes. It just implies that further uptrend may not be as strong as the previous one. Nevertheless, the stock is likely to move up from these levels; For the long term investors, 854 should be the target.

GE Shipping:

This stock too, is bullish in medium term chart. It appears to have completed wave 2 as it has already closed above 61.8% retracement. A weekly close above 369 with good volumes will ensure an upside breakout. The stock may be expected to achieve a target of 597.

Great Offshore:

The stock is in consolidation pattern, with a possible upside breakout. When that happens, it will be a confirmation of “bullish flag” pattern. See my earlier article “Top 10 Hot India Stocks for July 2007” in which we discussed about this pattern with the daily chart of Evenix Accessories Limited. So medium term investors can stay invested in the stock.

Shipping Corporation of India:

The stock had broken out in February 2007 as can be seen in the chart. In the last few months it has formed two lower highs and lower lows; but it can be seen that the stock has not yet closed below the support trendline even once. This is an indication that the stock is still bullish. Also, at support levels, a bullish “three outside up” candlestick pattern has been formed. This is yet another confirmation of bullishness. The stock can be expected to touch 291 in the medium term.

South East Asia Marine & Construction:

This stock has had a “rising channel” pattern in the weekly charts as shown below.

The prices fluctuate between two parallel trendlines which have positive slopes (moving upwards). The stock will continue channeling upwards until it is able to break either the upper or lower trend line. An upside break is bullish, while a downside break is bearish. There is no downside breakout yet, and we have to look for a confirmation on the upside.

Varun Shipping Company:

This is the only stock that is yet to encounter a resistance breakout in the medium term charts. It has made higher highs and higher lows; prices have penetrated the resistance trendline; but the stock has failed to close above the resistance line.

The stock had fallen from a high of 99 in May 2006 to a low of 49.40 in March 2007 (50% fall when the Nifty gained about 25% during this period!). Higher highs and higher lows have been formed, indicating the stock is bullish; but the stock failed to break its resistance at 68.30 on weekly close basis. But it is still bullish in medium term charts.

Conclusion:

All the seven stocks discussed above are good for investment from a medium term perspective.
Wednesday, August 29, 2007

Buy these 5 Stocks before the run up

In my earlier article, “Top Ten Signs a Stock is Going to Move up or down” we discussed about possible technical reasons for stock price movements. One of them was candlestick patterns. These can be used to identify investment and trading opportunties particularly at support and resistance levels.

The most common method used by technical traders to enter ‘long’ positions i.e. (buy first and sell later) is ‘buy on resistance breakout’. We had picked several stocks in my earlier articles based on breakouts. But the risk associated with this method is that the stock can retrace back to support levels. After a correction traders can identify a possible reversal at support level and it can be used to initiate a trade.

The reversals discussed below are based on “Three inside up” candlestick patterns. There have been few theories that candlestick patterns work well in some markets better than others. But, when identified properly and applied correctly, these can be found to work in any financial market. The Japanese have strong belief that candlestick charting is a very powerful analytical technique. I have always used candlesticks in my analysis.

Bombay Dyeing & Manufacturing Company Limited:

Bombay Dyeing belongs to the well known Wadia group. They have diversified businesses in textiles, chemicals, aviation, food and health care industries. The company was established in 1879. Cotton spun yarn dyeing was then carried out manually. Today, this company exports more than 50% of its production to USA, UK, Germany etc. It has presence in all the major continents. The company’s net profits were worth Rs.36 crores in 2006 – 07.

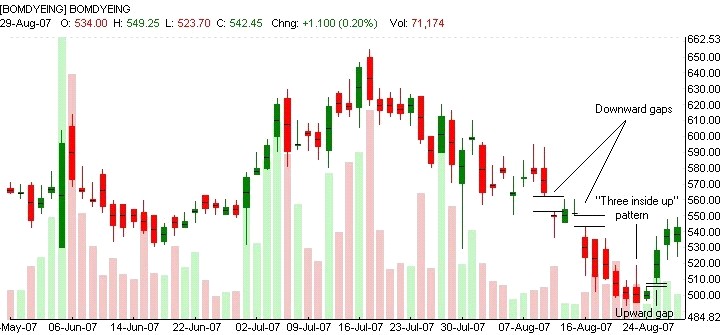
In the daily chart shown above, the two downward “gaps” can be noticed. It simply means that there was more supply than demand on those sessions. But invariably, these gaps get closed when the stock reverses. A “Three inside up” pattern i.e. “Harami” pattern followed by a higher close and green candle has been formed. Note the upward gap on the third day. 61.8% retracement works out to be 593.

GTL Infrastructure Limited:

GTL Infrastructure provides necessary infrastructure for mobile phone operators. The entire package includes ground based/roof top towers, microwave racks, cable racks, electrical accessories etc.

The tower packages are owned by GTL Infrastructure while operators pay monthly or quarterly for using the facilities. The company declared a net profit of Rs.10 crores for the quarter ended June 2007.

A “Three inside up” pattern has been formed in the daily chart of the stock near support level on August 27. The previous high at 38.55 is the first target for the stock during the pull back rally. The technical target is 40.40 which is 61.8% retracement.

Kotak Mahindra Bank Limited:

We discussed about this stock in my previous article, “Hot or Not? Private sector banks on a roll!”. Kotak Mahindra Bank offers total financial solutions to customers, from personal/corporate banking, stock broking, life insurance, investment banking, loans etc. Mahindra & Mahindra have a stake in the bank.

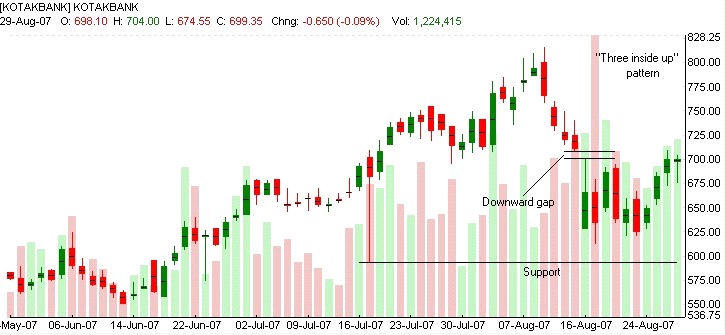
Again, a “Three inside up” pattern has been formed in the daily chart. The previously formed downward gap temporarily acts as minor resistance for the stock. A close above 714 would mean that the 50% retracement is achieved and also the resistance would be broken. Once it happens the stock should be able to test its previous high at 815.

It is important to note that the formation of candlestick patterns in areas other than support or resistance levels may not really reflect a reversal. Hence the first task in deciding whether to enter a trade based on candlestick patterns is to identify support and resistance levels.

Shipping Corporation of India Limited:

The Government of India has about 80% stake in this company. For more than 40 years, SCI owns and operates 35% of Indian tonnage and it has diversified in nearly all areas of shipping business serving both national and international trades. It is the only Indian shipping company operating break bulk service, international container service, liquid / dry bulk service, offshore service, passenger service etc. It also monitors a large number of vessels on behalf of various government departments and organizations. Its net profits were Rs.1014 crores for the financial year 2006 – 07.

In this stock too, a “Three inside up” pattern has been formed. There are a couple of gaps in the chart, on August 6 and August 10. However they are very minor (less than 0.50% of close price) and may be ignored. 61.8% retracement works out to 207 and this is the technical target for the current pull back rally.

Sunil Hi-Tech Engineers Limited:

Sunil Hi-Tech Engineers Limited is engaged in the fabrication, erection / testing and commissioning of bunkers, boilers, fuel oil systems etc. in the power sector.

It reported a net profit of Rs.7.60 crores during the financial year 2006 – 07.

The stock has more than doubled in the last 3 months. It has not fallen much during the recent correction. In this stock also, a “Three inside up” pattern has been formed. The support trendlines are intact; an indication that the stock is still bullish. On the second day of the candlestick pattern, a “doji” body as been formed. This has more significance, since a harami cross pattern is more reliable than a harami pattern. The stock is likely to test its previous high at 234.90.

Sunday, August 5, 2007

Top Ten Signs a Stock is Going to Move up or down

We have seen in my earlier articles about stock prices moving up or down and possible technical reasons for such movements. Let us discuss them in detail.

Breakout from consolidation patterns:

“Consolidation” means the stock moves in a narrow price range (also called sideways movement) for a reasonable amount of time, say few months. During this period, the tussle between buyers and sellers is in equilibrium and once this is disturbed, a “breakout” occurs and prices go up or go down considerably, with good volumes (volume is simply the total number of shares traded in a specified period, i.e. a session, week or month.)

The following example illustrates an upward breakout.

Close price moved between 18.50 and 20 for almost a year before ‘breaking out’ on the upper side with volume. Within a short span of time stock gained nearly 250%. Similar pattern is valid for downside breakout too.

Breakout from chart patterns:

By chart patterns we mean formation of a geometrical figure such as a rectangle, triangle, wedge or special shapes such as cup and handle, flag, pennant, head and shoulder etc. These are formed over a period of time as price action continues. Some of the important bullish “reversal” patterns are double bottoms, triple bottoms, inverse head and shoulders; bearish reversal patterns are double tops, triple tops, head and shoulders. By reversal we mean the trend has changed from bullish to bearish or vice versa. Some of the bullish “continuation” patterns are ascending triangles, flags, cup and handle etc; bearish patterns include descending triangle, symmetrical triangles etc. By continuation we mean extension of the current uptrend or downtrend.

Following example describes a “double top” pattern.

There are 2 peaks in this pattern. First one registered a vey good volume when buying was at full swing. The second peak does not show similar volume which implies that the investors are not much interested in the stock. As a result, downtrend starts and stock breaks its support (a price at which buyers are expected to enter and push prices up). Once this happens, prices fall continuously due to lack of buying interest. This is a “bearish” pattern.

Candlestick patterns:

Candlesticks originated in Japan and are in use since 16th century. A candlestick pattern may consist of two, three or more candlesticks. Common examples are engulfing pattern, harami pattern etc. These can be visualized to be like eclipses. When formed during a corrective decline in an uptrend, these patterns offer trade opportunities, as sellers fade out and buyers enter the market.

In the example given below, a “red” candle (i.e. open price of the day is higher than close price) is engulfed (covered) by a “green” candle (i.e. close price is higher than day’s open price). This means that after a decline in price, at support levels buyers enter and extend buying support. This is usually confirmed by another green candle and higher trading volumes on the next day (see the chart).

Positive and Negative divergences:

These are considered to be signals of major shifts in price movement. A “positive” divergence occurs when a stock falls to a new low but a technical indicator such as MACD (moving average convergence divergence) makes a new high. A “negative” divergence occurs when stock makes a new high, but a technical indicator fails to achieve the same.

The chart displayed below shows an example of “negative” divergence.

Upward and Downward Gaps:

An upward gap occurs when today’s low is higher than yesterday’s high. A downward gap occurs when today’s high is lower than yesterday’s low. These gaps indicate strong demand for the stock when accompanied by good volumes.

Here’s a case of upward gap:

The stock gained more than 30% after the upward gap formation. Needless to mention that the upward gap formed in an uptrend has more significance than the one formed in downtrend.

Bull traps / bear traps:

These are special situations in which the stock may break its resistance to form a new uptrend; but due to lack of buying support it may fall again to original levels. Bear traps are formed when a stock breaks its previous low but instead of going down further, the prices move up as a result of aggressive buying. These do not occur every time resistances or supports are broken.

In the above chart, the support was broken on June 7 this year. Instead of more sellers coming in, buying started vigorously and the stock nearly doubled. But during the corrective decline no major support was available and it came down to its previous resistance levels.

Technical rallies due to overbought and oversold conditions:

Stock prices move up and down endlessly. Once an ‘overbought’ or a saturated condition is reached, sellers enter to book profits. As a result prices fall to their support levels. In case of oversold conditions, buyers enter to take new positions. These are technical rallies, which usually occur at critical retracement levels of 38.2% and 61.8% retracements.

In the chart shown above, the stock had closed below its 61.8% retracement level which is a critical support. The bulls immediately pushed up the prices above its previous high. This is a case of a technical rally.

Over manipulations:

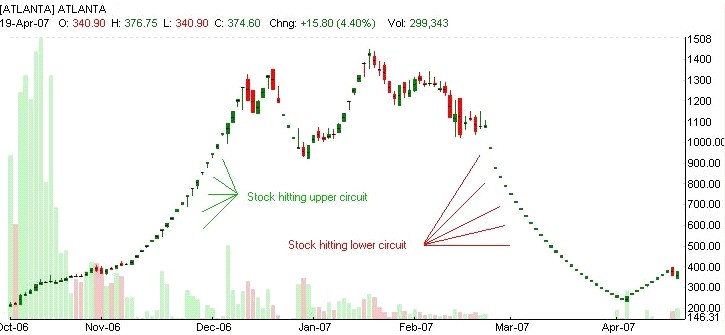
We do know that stock prices are determined by the market participants. But in some cases, we find only buying or sometimes only selling. In other words, once a stock begins to trade it hits the upper circuit or lower circuit. This can be considered as a case of “over manipulation” and usually occurs in low volume, illiquid stocks. In high volume stocks invariably intra day trading takes place. So the possibility of occurrence of “freezes” is minimal.

Watch how many days the stock has hit upper freezes during its first uptrend. During the downtrend, it does exactly the reverse – leaving sellers stranded. This could be regarded as a one sided price movement for most of the time.

Uniform price volume action:

In an healthy uptrend, increase in volumes is accompanied by increasing prices and during a pull back volumes dry up as prices decline. This is reversed in a downtrend, as volumes increase while prices decrease and during a pull back volumes decrease as prices increase. Following example depicts this action.

Uniform price volume action can be seen in the above chart. During uptrend prices rise and so are volumes; during a downtrend prices drop and so are the volumes. This is an indication of a ‘normal’ uptrend. However, it does not occur in all the stocks all the time.

Dead cat bounce or fall:

The term dead cat bounce means that the stock has staged a smart recovery or moderate gain after a steep fall. The same thing can be considered for a fall too. After gaining moderately the stock can fall heavily. These occur due to technical reasons such as coveing up short or long positions. If the stock falls back to its original level after the recovery it is a bounce. Otherwise, it could be a new bottom.

In the above example it can be seen that the stock rallied signficantly for a few days only to decline again and reach further lows. This type of a rally should be used only to exit the stocks.