Showing posts with label Bajaj Hindustan. Show all posts

Monday, October 22, 2007

Which of India’s Top 10 “Family Named” Stocks is Most Valuable? – Part 3 of 3

Now, it’s time to analyze the “Family Named” stocks based on:

  • Performance in the last five years
  • Valuations (Price/Earnings and Price/Book value ratios)
  • Current technical status

Ranking based on stock performance:

Scrip

5 year return

Scrip

1 year return

KIRLOSOIL

3,011.65

ABIRLANUVO

85.04

BAJAJHIND

2,804.17

JINDALSAW

59.08

ABIRLANUVO

1,774.42

SRIADIKARI

41.54

DALMIACEM

1,755.15

RPGCABLES

37.93

M&M

1,625.08

KIRLOSOIL

32.36

JINDALSAW

814.07

DALMIACEM

14.53

TATATEA

400.19

TATATEA

6.86

RPGCABLES

344.44

M&M

5.78

PATNI

NA

PATNI

(0.62)

SRIADIKARI

(26.75)

BAJAJHIND

(47.39)

It can be seen Aditya Birla Nuvo and Kirloskar Oil Engines find a place in the top 5 based on stock performance.

Ranking based on valuations:

The following table sorts out the stocks based on P/E and P/BV ratios.

Scrip

P/E

Scrip

P/BV

ABIRLANUVO

77.17

M&M

4.92

TATATEA

24.33

ABIRLANUVO

4.81

RPGCABLES

21.67

KIRLOSOIL

4.02

KIRLOSOIL

20.62

DALMIACEM

3.19

M&M

18.61

TATATEA

3.10

PATNI

15.73

JINDALSAW

3.01

SRIADIKARI

13.95

PATNI

2.77

BAJAJHIND

12.87

BAJAJHIND

1.80

JINDALSAW

10.57

SRIADIKARI

0.87

DALMIACEM

8.28

RPGCABLES

(8.26)

In my previous article, “Top value stocks in Indian markets” we discussed the relationship between P/E ratio and P/BV ratio. These two parameters can help an investor to identify “growth” and “value” stocks in the market. Growth stocks usually have high P/E and P/BV ratios, which means that these stocks are relatively high-priced in comparison with the companies’ net asset values. In contrast, value stocks have relatively low P/E and P/BV ratios. Most growth investors are willing to pay a fairly high price for a stock whose earnings they expect to go up higher. Value investors (Rakesh Jhunjhunwala for example) view cheapness as a major factor. They focus on stocks that are relatively cheaper.

Aditya Birla Nuvo and Kirloskar Oil Engines can be classified as “growth” stocks whereas Patni Computer Services and Jindal Saw can be classified as “value” stocks.

Ranking based on current technical scenario:

The following tables shows the summary of the technical status of stocks for short term, medium term and long term. It is to be remembered here that these can change when confirmed reversal signals appear on charts.

Since Sri Adhikari Brothers Television Networks will be suspended for consolidation of face value, it is excluded from our analysis. Its status need to be ascertained after relisting.

Scrip

Short term

Medium term

Long term

ABIRLANUVO

Bearish

Bullish

Bullish

BAJAJHIND

Bullish

Sideways

Bearish

DALMIACEM

Bullish

Bullish

Bullish

JINDALSAW

Bearish

Bearish

Bullish

KIRLOSOIL

Bullish

Bullish

Bullish

M&M

Bearish

Bearish

Bearish

PATNI

Bearish

Bearish

Bearish

RPGCABLES

Bearish

Bearish

Bearish

SRIADIKARI

-

-

-

TATATEA

Bearish

Bearish

Bearish

It can be seen that Aditya Birla Nuvo and Kirloskar Oil Engines are bullish for both medium term and long term.

Conclusion:

Kumar Mangalam Birla

Atul C Kirloskar

Based on the above analysis, we can conclude that Aditya Birla Nuvo and Kirloskar Oil Engines are the winners in this contest.

Sunday, August 5, 2007

Top Ten Signs a Stock is Going to Move up or down

We have seen in my earlier articles about stock prices moving up or down and possible technical reasons for such movements. Let us discuss them in detail.

Breakout from consolidation patterns:

“Consolidation” means the stock moves in a narrow price range (also called sideways movement) for a reasonable amount of time, say few months. During this period, the tussle between buyers and sellers is in equilibrium and once this is disturbed, a “breakout” occurs and prices go up or go down considerably, with good volumes (volume is simply the total number of shares traded in a specified period, i.e. a session, week or month.)

The following example illustrates an upward breakout.

Close price moved between 18.50 and 20 for almost a year before ‘breaking out’ on the upper side with volume. Within a short span of time stock gained nearly 250%. Similar pattern is valid for downside breakout too.

Breakout from chart patterns:

By chart patterns we mean formation of a geometrical figure such as a rectangle, triangle, wedge or special shapes such as cup and handle, flag, pennant, head and shoulder etc. These are formed over a period of time as price action continues. Some of the important bullish “reversal” patterns are double bottoms, triple bottoms, inverse head and shoulders; bearish reversal patterns are double tops, triple tops, head and shoulders. By reversal we mean the trend has changed from bullish to bearish or vice versa. Some of the bullish “continuation” patterns are ascending triangles, flags, cup and handle etc; bearish patterns include descending triangle, symmetrical triangles etc. By continuation we mean extension of the current uptrend or downtrend.

Following example describes a “double top” pattern.

There are 2 peaks in this pattern. First one registered a vey good volume when buying was at full swing. The second peak does not show similar volume which implies that the investors are not much interested in the stock. As a result, downtrend starts and stock breaks its support (a price at which buyers are expected to enter and push prices up). Once this happens, prices fall continuously due to lack of buying interest. This is a “bearish” pattern.

Candlestick patterns:

Candlesticks originated in Japan and are in use since 16th century. A candlestick pattern may consist of two, three or more candlesticks. Common examples are engulfing pattern, harami pattern etc. These can be visualized to be like eclipses. When formed during a corrective decline in an uptrend, these patterns offer trade opportunities, as sellers fade out and buyers enter the market.

In the example given below, a “red” candle (i.e. open price of the day is higher than close price) is engulfed (covered) by a “green” candle (i.e. close price is higher than day’s open price). This means that after a decline in price, at support levels buyers enter and extend buying support. This is usually confirmed by another green candle and higher trading volumes on the next day (see the chart).

Positive and Negative divergences:

These are considered to be signals of major shifts in price movement. A “positive” divergence occurs when a stock falls to a new low but a technical indicator such as MACD (moving average convergence divergence) makes a new high. A “negative” divergence occurs when stock makes a new high, but a technical indicator fails to achieve the same.

The chart displayed below shows an example of “negative” divergence.

Upward and Downward Gaps:

An upward gap occurs when today’s low is higher than yesterday’s high. A downward gap occurs when today’s high is lower than yesterday’s low. These gaps indicate strong demand for the stock when accompanied by good volumes.

Here’s a case of upward gap:

The stock gained more than 30% after the upward gap formation. Needless to mention that the upward gap formed in an uptrend has more significance than the one formed in downtrend.

Bull traps / bear traps:

These are special situations in which the stock may break its resistance to form a new uptrend; but due to lack of buying support it may fall again to original levels. Bear traps are formed when a stock breaks its previous low but instead of going down further, the prices move up as a result of aggressive buying. These do not occur every time resistances or supports are broken.

In the above chart, the support was broken on June 7 this year. Instead of more sellers coming in, buying started vigorously and the stock nearly doubled. But during the corrective decline no major support was available and it came down to its previous resistance levels.

Technical rallies due to overbought and oversold conditions:

Stock prices move up and down endlessly. Once an ‘overbought’ or a saturated condition is reached, sellers enter to book profits. As a result prices fall to their support levels. In case of oversold conditions, buyers enter to take new positions. These are technical rallies, which usually occur at critical retracement levels of 38.2% and 61.8% retracements.

In the chart shown above, the stock had closed below its 61.8% retracement level which is a critical support. The bulls immediately pushed up the prices above its previous high. This is a case of a technical rally.

Over manipulations:

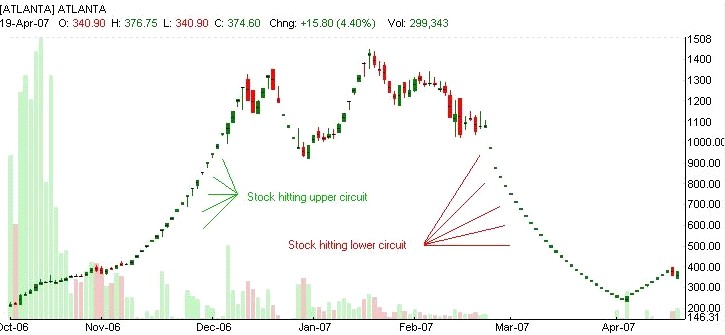
We do know that stock prices are determined by the market participants. But in some cases, we find only buying or sometimes only selling. In other words, once a stock begins to trade it hits the upper circuit or lower circuit. This can be considered as a case of “over manipulation” and usually occurs in low volume, illiquid stocks. In high volume stocks invariably intra day trading takes place. So the possibility of occurrence of “freezes” is minimal.

Watch how many days the stock has hit upper freezes during its first uptrend. During the downtrend, it does exactly the reverse – leaving sellers stranded. This could be regarded as a one sided price movement for most of the time.

Uniform price volume action:

In an healthy uptrend, increase in volumes is accompanied by increasing prices and during a pull back volumes dry up as prices decline. This is reversed in a downtrend, as volumes increase while prices decrease and during a pull back volumes decrease as prices increase. Following example depicts this action.

Uniform price volume action can be seen in the above chart. During uptrend prices rise and so are volumes; during a downtrend prices drop and so are the volumes. This is an indication of a ‘normal’ uptrend. However, it does not occur in all the stocks all the time.

Dead cat bounce or fall:

The term dead cat bounce means that the stock has staged a smart recovery or moderate gain after a steep fall. The same thing can be considered for a fall too. After gaining moderately the stock can fall heavily. These occur due to technical reasons such as coveing up short or long positions. If the stock falls back to its original level after the recovery it is a bounce. Otherwise, it could be a new bottom.

In the above example it can be seen that the stock rallied signficantly for a few days only to decline again and reach further lows. This type of a rally should be used only to exit the stocks.


Friday, June 8, 2007

“Sectorwise” performance: myth or miracle?

Introduction:

In a stock exchange, several companies are listed. Some of them belong to a particular industry or “sector”. For example, in the banking sector there are several listed banks, public sector banks such as State Bank of India, Punjab National Bank, Indian Overseas Bank etc. Examples of private sector banks include Karur Vysya Bank, Kotak Mahindra Bank, Karnataka Bank etc.

In the popular financial newspapers, magazines and television channels we often encounter reports like “the sugar sector is performing extremely well”, “the media sector is on fire”, “the textile stocks are outperforming the overall market” etc. This essentially means that the stocks from a particular sector are wanted by the crowd strongly compared to some other sector. Why does this happen?

If anyone had been an active market participant, he would know what the normal stock market practice is.

  1. Some people have their own ideas, they think the time has come to enter a particular stock or exit. They are “intution” based investors.
  2. Few invest or trade based on others’ view or reports. There are hundreds of web sites and magazines offering investment advice, such as buy/hold/sell strategy. Some TV Channels allocate a time slot exclusively for this purpose.
  3. Part timers believe in “buy on rumour and sell on news”. They somehow manage to get information from “reliable” sources and act accordingly. This may or may not work all the time.
  4. People who know the risks and rewards of stock market, the professionals always try to analyze the market and form a strategy that suits them with regard to time frame and profit margin. These people are somewhat rare.

Usually, a stock runs up expecting some “good news” or “positive news”. For example, depreciation of rupee value could be a booster for the software industry since they will get more rupee for each dollar earned. The federal government may allow export of a commodity more than the usual quota or a company may acquire another well performing company. Example of “bad news” or “negative news” may include losing a lawsuit, loss of revenue due to changing business conditions, price increase of a certain commodity (such as aviation turbine fuel may be negative for airline sector).

People may have noticed that the stock may not go up as positive news was published in the media. This is because the stock has already run up expecting the news.

The stock price, usually goes up or down, whether in the short, medium or long term as and when this kind of situation arises. The demand can be seen for a stock when the crowd expects a positive news and a sell off can be witnessed when the crowd anticipates a negative news.

The daily chart of UTV Software Communications Limited is shown below. The stock ran up sharply from 179.55 on 01/11/06 to 278.65 on 14/11/06.

The following text is from NSE regarding this stock dated 08.11.06:

“The media had reports that News Corp may pick up a sizeable stake in UTV Software Communications Limited. The Exchange, in order to verify the accuracy or otherwise of the information reported in the media and to inform the market place so that the interest of the investors is safeguarded, had written to the officials of the company. UTV Software Communications Limited has vide its letter inter-alia stated, "Please note that the article is an independent story by the publication and did not emanate from any official press release from the Company. As regards the news article, 'News Corp eyeing sizeable stake in UTV', we have to say that, at present there are no such proposals having been discussed by the Board of Directors of the nature stated in the news report."

So the company did deny such rumours floating in the media. But few days later, more news came out, this time though, it was issued by the company itself: (Source: Corporate Announcments in NSE)

Dated 24.11.06:

“Utv Software Communications Limited has informed the Exchange that the Company has received the approval from Government of India, Ministry of Finance, Department of Economic Affairs, Foreign Investment Promotion Board (FIPB) unit granting its approval for the acquisition of the entire shareholding by The Walt Disney Company (Southeast Asia) Pte Ltd (Disney) in United Home Entertainment Limited (Hungama TV). The said entire shareholding of Hungama TV is being acquired by Disney at an enterprise value of USD 31.125 million”

Dated 27.11.06

“Utv Software Communications Limited has informed the Exchange that the Company has entered into a term sheet with Astro Multimedia International (BVI) Limited (Astro) for establishing a television channel joint venture business in India, South Asia and South East Asia. The scope of business of the joint venture company will be to create, develop, produce, own and operate one or more TV broadcast channels targeted at the age group of 15 to 25 in India, South Asia and South East Asia. The Company and Astro will hold 50% each of the equity capital of the Joint venture company. The aforesaid is subject to all regulatory approvals required for operating televisions channels in the territory being obtained and definitive agreements.”

Dated 08.12.06

“Utv Software Communications Limited has informed the Exchange that "The Company (1) Has entered into an arrangement with Indiagames Limited and its promoters for acquisition of controlling equity stake in Indiagames Limited, a Mumbai based mobile and online gaming company for a consideration of around Rs. 68 crores. (2) Has entered into an arrangement with Ignition Entertainment Limited and its promoters for acquisition of controlling equity stake in Ignition Entertainment Limited, a UK based company involved in developing console games for a consideration of around Rs. 60 crores. (3) Has initiated development of animation movie projects with total investments to the tune of Rs. 135 crores over a period of next three years.”

It can clearly be seen that the stock ran up expecting positive news. The story floating in the market place was obviously something different, but ultimately there was some news officially declared by the company.

The above was just an example of a particular stock moving up based on expectation of positive news. The sector wise movment was noticed between October 2003 and April 2006 in the same manner in sugar stocks.

The following table gives the stocks’ appreciation in sugar sector.

Scrip

Close 1

Close 2

Gain

Current


30.09.03

28.04.06


Price

BAJAJ HINDUSTAN *

13.60

534.50

39.30

162.95

THIRU AROORAN SUGAR

32.80

598.70

18.25

121.15

SAKHTI SUGAR

22.45

252.10

11.23

88.70

KCP SUGAR INDUSTRIES *

2.68

73.75

27.52

18.00

* Adjusted close price due to stock split

So, what was the bad news in May 2006 that started the “steep” fall to the current levels?

http://in.biz.yahoo.com/061213/203/6a9mw.html says:

“…In response to the rising prices in the domestic market, the government had clamped a ban on sugar exports in July, 2006. The global prices were lucrative at at time, ruling in the range of $420 to $460 a tonne. The domestic price rise was due to a combination of several factors like hoarding and manipulation in the future markets and not due to shortage. Since the imposition of the export ban, the industry has been lobbying for its removal. The government had at the same time also allowed sugar imports against low duty, but no substantial amount has entered the country…”

It can be clearly seen that the market participants knew that the bad news was already on the the cards and decline started in May 2006.

Conclusion:

The news based buying or selling is not a great strategy for an ordinary investor. Rather, he should look for increasing his profits either by his own research or getting some qualified expert advice. News based rally never really lasts long.