Showing posts with label Omaxe. Show all posts

Sunday, September 6, 2009

Nifty faces strong resistance for medium term

It has been well established by Ralph N. Elliott in his Elliott Wave Theory that price movements of a security can be predicted by observing and identifying a repetitive pattern of waves. The price movement consists of 5 waves in the direction of the main trend followed by 3 waves in the corrective trend. The duration of these waves can last for centuries (Grand Supercycle), decades (Supercycle), years (Cycle), months (Primary), weeks (Intermediate / Minor), days (Minute), hours (Minuette) and minutes (Sub-Minuette). The 5-3 pattern remains constant although the time span of each may vary.


Technical traders use this theory to identify breakouts for profitable investment opportunities. There are several web sites and books related to this theory; Wikipedia describes the principles in detail. Cyclpro has an exhaustive list of rules and guidelines which need to be observed during the Elliott Wave Analysis.


However, for those with limited resources of time and energy, there are few basic rules that need attention.


  1. Wave 2 cannot retrace beyond low of Wave 1; i.e. not more than 100%
  2. Wave 3 is never the shortest among impulse waves 1, 3 and 5. This means either Wave 1 could be the shortest or Wave 5 could be the shortest.
  3. Wave 4 cannot fall below high of Wave 1.

Using Fibonacci retracements of 38.2% and 61.8%, following relationships between waves can be identified.


Wave 2 = 61.8% of Wave 1

Wave 3 = 161.8% of Wave 1

Wave 4 = 38.2% of Wave 3

Wave 5 = 100% of Wave 1


The above values are approximate and have been found to occur frequently in well trending markets. It is not uncommon for Wave 2 to fall below 61.8%, there are cases in which Wave 2 has retraced only 38.2% of Wave 1. Similarly, Wave 3 has sometimes retraced even 261.8%.


So, what may happen in case these guidelines are violated?


The answer is simple. The move becomes “suspicious.” This is usually considered as a warning sign; a trend reversal may follow soon.


Let us now discuss the long term chart of Nifty.


In the above chart, it can be seen that:


  1. The long term bull market started in April 2003 when Nifty had a low of 920
  2. Wave 1 ended at 2015 during January 2004
  3. Wave 2 retraced 66% and ended during May 2004.
  4. Wave 3 retraced 227% of Wave 1 and ended during May 2006.
  5. Wave 4 retraced 47.4% of Wave 3 and ended during June 2006.
  6. Wave 5 retraced 343% of Wave 1 and ended during January 2008.
  7. Wave a retraced 75.5% of the entire movement from low of Wave 1 (920) to high of Wave 5 (6357) and ended during October 2008 with a low of 2253.
  8. Wave b has retraced 60.7% of Wave a when it touched 4744 in August 2009.

Cyclepro guidelines suggest that Wave b is likely to retrace 38.2%; the next most likely retracements are 50% and 61.8%. It also says that the time taken by Wave b is usually between 61.8% and 161.8% of the time taken by Wave a. Wave a lasted for 9 months; wave b is currently in its 11 th month.


Taking all these facts into account, we may come to the conclusion that Wave b may end anytime and Wave c is likely to start afterwards.


Nifty has not shown any kind of reversal signs so far in daily charts. The support trendline remains unpenetrated yet. We may see some more sideways movement in the near future. Nifty will face strong resistance around 4797.


Bullish stocks for short term:


CMP = Current Market Price BB = Bullish Breakout TT = Technical Target


  1. Binani Cement: CMP 63.55 BB on August 28 TT 83.85
  2. Gitanjali Gems: CMP 117.65 BB on August 25 TT 162.30
  3. ISMT Limited: CMP 37.55 BB on August 27 TT 56.40
  4. Omaxe: CMP 116.45 BB on August 28 TT 170
  5. Tata Sponge: CMP 222.40 BB on September 4 TT 265.80

Sunday, August 3, 2008

Top 5 bearish stocks for short term

Alstom Projects India (411.70):

During the fall from the high of 1199 formed during last November, the stock found support at 465 on March 24 . The extended rally which followed made the stock touch a high of 739.95 after a month. On June 9 the stock broke the support level and continues to trade below it. A new low of 308.25 was made on July 2. The stock was not able to break the resistance (i.e. previous support) on two occasions. The volumes on the second peak were less compared to the first; though the stock formed a higher high, MACD histogram formed a higher low, leading to negative divergence. This stock is truly for the bears.

Hotel Leela (31.45):

Like Alstom Projects India this stock too, found a bottom on March 24 at 37.65. But after breaking the support on June 12 it had a minor bounce back. Once again it broke the support on June 23. It is currently on a downtrend after failing to close above the resistance at 34. One shouldn't expect much from the stock in the short term.

Moser Baer (90.45):

This stock broke the March 24 low of 119 on July 1. Between July 10 and July 16 it witnessed heavy selling. It formed another low of 87.80 on August 1 when it broke the previous low of 88.20 made on July 17. As such no bullish reversal signs have appeared on chart and the bearish trend is likely to continue.

Omaxe (124.85):

This is yet another badly affected stock in the last 8 months. It has fallen from the high of 612.50 on December 13, 2007 to a low of 111 on July 2, 2008. It is really struggling to be precise - having closed below the 61.8% retracement 6 times after wave 1 formation. This is an indication that the stock is unlikely to break its resistance at 144.80. Even if it manages to break, there are more chances of stock reversing again.


Pyramid Saimira Theatre (167.10):

The stock broke the March 24 low of 250 on June 20 and closed below it. Though a minor rally was seen it was not good enough to take the stock above the resistance level on a close basis. Vigorous selling was seen on June 30 and July 1 losing 16% and 20% respectively. Currently the trend is pretty much flat and one may consider entering only after confirmed reversal signs appear on charts.

Saturday, March 22, 2008

Real Estate Stocks : Is it wise to invest now?

If anyone had invested in land, house or flat, he would have definitely gained a lot due to the soaring property prices. But what about the stocks of real estate companies? The table given below suggests that these have been badly affected by the recent fall in Indian stock markets.

Is it wise to invest in these stocks now? A big question mark, though.

Note that Omaxe, Parsvnath, Kolte-Patil, IVR Prime and Sobha are currently trading below their IPO prices.


Sunday, October 7, 2007

Review of select real estate sector stocks

The India Street previously analyzed the following IPO’s:

These stocks have been listed and we had discussed in my previous article, “How do IPO’s fare in Secondary Market?” about how IPO stocks are received by the market particpants. Some stocks perform exceptionally well and some others get discarded by the crowd.

In this article, let us discuss the short term perspective of the five stocks mentioned above using daily charts.

Summary:

Scrip

IPO Price

Price 05-Oct

% return

DLF

525

851.10

62.11

HDIL

500

722.20

44.44

IVRPRIME

550

441.30

(19.76)

OMAXE

310

317.40

2.39

PURVA

400

460.45

15.11

We indicated that IVR Prime might be avoided in the short term. It may be noted that Puravankara had extended the IPO subscription period by five days and also reduced the price band from 500 – 525 to 400 – 450 per share. This happened at a time when the “US Sub-prime mortgage crisis” was being cited as the reason for stock market collapse.

The following table gives the BSE Group/Scrip codes for the stocks.

NSE Symbol

BSE Group

Scrip Code

DLF

A

532868

HDIL

A

532873

IVRPRIME

A

532881

OMAXE

A

532880

PURVA

A

532891

DLF:

The stock got listed on July 5. On August 13, it touched a low of 490, 35 less than its IPO price (See chart below).

The long lower shadow when it broke the support indicates that there was lot of buying support at lower levels. Technically, it broke its short term resistance on September 19 with an upward gap. On October 3, it managed to touch a high of 904, gaining 16.38%. If we consider 100% retracement from the low of 490, the target for this upmove works out to 980.

On October 3, the BSE had made an announcement that “the Company has been awarded the project to develop a ‘New Bangalore City’ in Bidadi following a global tender issued by Bangalore Metropolitan Regional Development Authority (BMRDA). The project shall generate value in excess of Rs. 50,000 crore (USD 12.5 billion), which is the single largest investment in real estate in India.”

It may be noted that the ‘news’ arrived in the marketplace nearly two weeks after it had broken its resistance. This is a good example of how the stock market works.

HDIL:

This stock too, had gone below its IPO price of Rs.500 on August 6 after getting listed on July 24. Interesting to note that it touched a high of 634.30 on July 26.

The stock recorded a low of 477.50 on August 22. At the time of the so called US Sub-prime mortgage crisis, this stock closed below its IPO price on 4 occasions – only to bounce back. Similar to DLF, the stock had broken its resistance on September 19 with an upward gap.

A bullish “harami” candlestick pattern was formed on September 26. On October 4, the stock had closed at 707.15, gaining 6.42%. There seems to be some more upside left, as the technical target from the low of 477.50 works out to be 773.

IVR Prime:

We gave the following reasons for avoiding the IPO in the short term.

  • Issue was slightly overpriced compared to others.
  • Except the Gachibowli project in Hyderabad, IVR Prime has not executed any other project; others are in planning stage.
  • The company owns only 14% of its projected 2,478 acres land bank.

On the day of listing i.e. August 16 the stock made a high of 495, 55 less than the IPO price. This is the critical resistance for the stock. On August 23 the stock made a low of 343. Though the stock closed above 425 on September 24, it registered a lower low of 358 on September 27. This violates the Elliot wave theory. Though 343 still remains intact, formation of a lower low during an uptrend indicates that a reversal is likely to follow.

Unless this stock closes above 495 with reasonably good volumes, one should not expect any upside from the stock. The market has endorsed The India Street’s view on the IPO.

Omaxe:

The stock opened at 410 on August 9 with a premium of Rs.100. It touched a high of 448 before closing at 349.35. However, it opened with a huge downward gap of 13.90 on August 16. On August 22 it touched a low of 263.15.

It can be seen from the above chart that wave 1 is complete and wave 2 is in progress. The stock faced resistance around 355.70 (50% retracement level) and it closed above it for 2 days in a row. With the current trend it has support at 304.10 which is 61.8% retracement level. The stock needs to break its resistance at 369.95 on a close basis in order to move upwards.

Puravankara Projects:

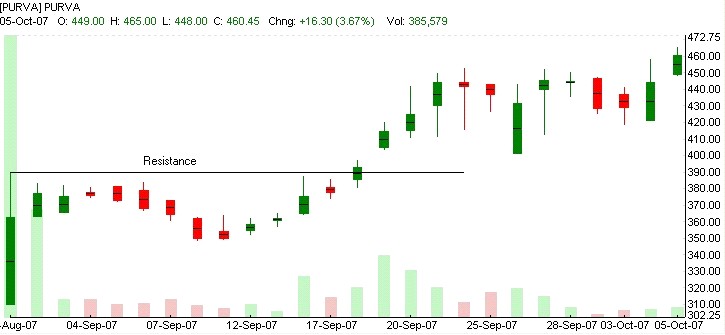
The stock opened with a negative premium of Rs.90 (IPO price: Rs.400) on August 30. It has been the lowest till today. After 13 trading sessions, it broke its previous high of 390 (made on day of listing) on September 18. On October 5 it closed above 452.50, a high made on September 24. The short term target works out to 501.60 when calculated from a low of 310.

Friday, August 10, 2007

India Stock Market – Weekly Review

Correction in Nifty continues; clear picture may emerge next week

In the last week’s review we discussed about “harami” candlestick pattern and it could be a confusing signal unless confirmed by a green candle and positive close above 4530. For this to happen, the index had to gain about 128 points, preferably with a full upward gap or even a partial upward gap. I had also mentioned that it didn’t seem to be a possibility since bulls were losing momentum on Friday.

As expected, confirmation couldn’t be achieved on Monday, as the market lost 62.05 points. However the bulls were seen in action on Tuesday as the market gained 16.85 points. But it formed an “inverted hammer” meaning the index was brought back near its opening price due to sell off at higher levels. On Wednesday the bulls were in perfect control; the Nifty gained 105.75 points. Again, a “three inside up pattern” was formed. The index achieved a high of 4530 on Thursday before collapsing once again by 58.90 points. So 4530 has acted as a strong resistance for the index. On Friday the market was deep in red with the index losing 164 points at one stage. However, the afternoon session saw bulls coming back once again. Nifty had lost 69.85 points today. On weekly basis the index has lost 68.20 points or about 1.55%.

In the daily chart of Nifty, we can see the “Three inside up” pattern (“Harami” followed by a green candle and higher close). Since the bulls failed to cross 4530 and after yet another fall, we have to maintain 4218 as the next support level.

Now that the index has closed below 4363 on Monday/Tuesday as well as today this should act as a minor resistance when Nifty reverses. Let us discuss the Fibonacci retracements as shown below.

It can be seen that 4310 (61.8% retracement level) has not yet been breached on a close basis, though low went below it on a couple of occasions. A close below this level would mean that when index reverses, it may find difficult to break its resistances and the trend may not be strong.

The intraday chart of Nifty for Thursday is been shown below. On Thursday bulls lost control in the afternoon while today they were back in action after 2 pm. Thursday’s quick fall meant that the market had a strong negative opening today. The bulls have managed to break intraday resistance and this could be positive for next week.

Today’s intraday chart is given below:

Intraday charts courtesy: NSE

Forecast for next week:

In all probability the market should recover and reverse in the coming week. We saw a strong lower side volatility and intraday resistance breakout today. At market tops and bottoms, volatility will be very high. So the level of 4310 needs to be watched on a close basis. A close below this will make the index more sluggish during pullback rally. A close above 4530 will mark the return of bulls and the market will be ready for further uptrend.

Advance / Decline Ratio:

Date

Adv.

Dec.

Unch.

06-Aug-07

314

790

24

07-Aug-07

724

369

31

08-Aug-07

841

258

31

09-Aug-07

268

843

24

10-Aug-07

309

799

26

This leads to an overall advance % of 43.46, decline % of 54.13 and unchanged % of 2.41% for the week.

Top Gainers / Losers among Index stocks:

Scrip

% Gain

Scrip

% Loss

HCLTECH

6.82

VSNL

8.57

GLAXO

5.74

HINDALC0

6.98

TCS

4.34

STER

5.86

SUZLON

4.28

ICICIBANK

5.61

BPCL

2.30

GAIL

5.10

Top Gainers / Losers in overall market:

Scrip

% Gain

Scrip

% Loss

ETCNET

92.71

ABGSHIP

17.63

CONSOFINVT

40.03

LOKESHMACH

11.45

ORBITCORP

37.79

IBREALEST

11.11

RUCHIRA

29.92

RENUKA

10.91

JAICORPLTD

27.63

GREAVESCOT

10.37

Please note that only ‘A’ group and ‘B1’ group stocks of Bombay Stock Exchange (BSE) are considered for the above table.

ETC Network is a case of bear trap. Orbit Corporation was The India Street short term pick. From 272.70 on June 29 it has appreciated to 504.30 today (85%). We discussed about Indiabulls Real Estate in “Technical review of select India stocks for medium term” and Shree Renuka Sugars in “How do IPO’s fare in Secondary Market?”.

The India Street analyzed Puravankara Projects Limited IPO. The issue closed on August 8 after the price band was revised to Rs.400/- to Rs.450/- per share. It got oversubscribed by 1.91 times. Qualified Institutional buyers oversubscribed the issue by 2.69 times, high networth individuals by 0.99 times and retail investors by 0.64 times. Omaxe got listed on August 9. It was issued for Rs.310. It opened with a premium of Rs.100 at Rs.410. It reached a high of 448 after listing. However, it couldn’t sustain selling pressure at higher levels and closed today at 345.75.

Our short term pick India Glycols closed at 184.80 on August 8, gaining 12.55% since our analysis on July 18. Long term pick Nagarjuna Fertilizers gained about 13.20% this week. Apart from these there are no other major movers among our short, medium or long term picks.

Sunday, July 15, 2007

Omaxe IPO A Good Investment – The India Street Analysis

The India Street analyzed DLF IPO and HDIL IPO recently. Another Delhi based real estate developer, Omaxe Limited plans to raise about Rs.605 crores through their initial public offering. The issue opens on July 17 and ends on July 20. The proceeds of the IPO will be utilized to acquire lands, repay loans and to meet construction costs.

The company was originally promoted by Rohtas Goel as Omaxe Builders Private Llimited in 1989. The primary objective was to venture into construction and contracting business. It became a limited company in 1999 and the name got changed as Omaxe Construction Limited. Now it is just Omaxe limited. The company has executed more than 120 industrial, institutional, commercial, residential and hospital construction projects. Omaxe entered into real estate development in 2001.

Within about 5 years of its entry, it has completed and delivered 10 projects (8 residential and 2 commercial) covering approx 5.13 million square foot area, with on time schedule. About 52 projects are in currently in progress. These include 1 hotel, 14 commercial complexes / shopping malls, 16 integrated townships and 21 group housing projects. Omaxe has declared land reserves of 3,255 acres, representing 150 million square foot of developable area, mainly in North India, but spread across nine states.

The company has received several awards such as ‘Svedala’, ‘Udyog Ratna', ‘Pride of the Country', ‘Arya Vaidya Sala' for excellence in construction.

The following tables show the company’s residential projects:

Delhi:

Location

Name

Status

Bahadurgarh

Omaxe North Avenue

In progress

Faridabad

Green Valley

Omaxe Hills

Omaxe Heights

The Forest

Delivered

In progress

Delivered

In progress

Location

Name

Status

Ghaziabad

Habitat Floors

Delivered

Greater Noida

NRI City

Omax Palm Greens

Delivered

Future plans

Gurgaon

The Nile

South Avenue

Mayfield Garden

Olive Apartments

Executive Floor

Delivered

Delivered

Delivered

Delivered

Delivered

Noida

The Forest

Royal Residency

Grandwoods

Omaxe Twin Towers

The Forest Spa

Delivered

Delivered

In progress

In progress

In progress

Designer Villas at South Avenue, Gurgaon

Haryana:

Location

Name

Status

Palwal

Omaxe City

In progress

Rohtak

Omaxe City

In progress

Sonepat

Omaxe City

In progress

Himachal Pradesh:

Location

Name

Status

Baddi

Omaxe Park Woods

In progress

Madhya Pradesh:

Location

Name

Status

Indore

Omaxe City

Omaxe City II

In progress

Future plans

Punjab:

Location

Name

Status

Derabassi

Omaxe Greens

In progress

Patiala

Integrated Township

Future plans

Ludhiana

Royal Residency

In progress

Rajasthan:

Location

Name

Status

Bhiwadi

Group Housing

Future plans

Jaipur

Omax City

In progress

Uttaranchal:

Location

Name

Status

Rudrapur

Omaxe Riveria

In progress

Uttar Pradesh:

Location

Name

Status

Ghaziabad

Habitat Floors

In progress

Lucknow

Omaxe City

Omaxe Heights

In progress

In progress

The following tables show the company’s commercial projects:

Delhi:

Location

Name

Status

Jasola

Wazirpur

Omaxe Citadel

Pearls Omaxe

In progress

In progress

Haryana:

Location

Name

Status

Gurgaon

Omaxe Plaza

Wedding Mall

House2Home

Delivered

In progress

In progress

Sonepat

Omaxe Mall

Future plans

Punjab:

Location

Name

Status

Amritsar

Omaxe Terminal Mall

Omaxe Novelty Mall

In progress

In progress

Ludhiana

Omaxe Plaza

Omaze Mall

In progress

In progress

Patiala

Wedding Mall

In progress

Pearls Omaxe at Wazirpur, Delhi

Uttar Pradesh:

Location

Name

Status

Agra

Wedding Mall

In progress

Greater Noida

Omax Arcade

NRI City Centre

Omaxe Cannaught Palace

Delivered

In progress

In progress

Indirapuram

Park Plaza

In progress

Lucknow

Omaxe City Centre

In progress

Except Omaxe Plaza at Gurgaon and Omaxe Arcade at Greater Noida (which have been sold), rest of the commercial projects are ‘Lease only’ model.

The company has got ISO 9001 certification from Det Norske Veritas (DNV), The Netherlands.

Financial performance in the recent past:

(All figures in Rs. Crores)

Item

2004

2005

Income

283.73

396.60

Expenditure

264.18

367.02

Profit before tax

17.24

26.37

Net profit

8.35

5.04

Item

2006

2007

Income

819.86

1,439.68

Expenditure

667.27

1,083.99

Profit before tax

146.70

322.32

Net profit

118.82

257.26

It can be noted from the above tables that the net profit has gone up from Rs. 5 crores in 2005 to about Rs.257 crores in 2007. This indicates strong demand for the real estate sector during this period.

The following table compares the EPS and book value among some listed real estate companies in India.

Company

EPS

Book value

Omaxe

16.72

29.87

Mahindra Gesco

3.50

189.30

Unitech

7.90

2.80

Parsvnath

5.7

69.9

Sobha

22.2

118.3

IPO details:

Start Date: 17 July, 2007

End Date: 20 July, 2007

Issue Size: 1,77,96,520 shares

Face Value: Rs.10

Price Band: Rs.265 – Rs.310

Market Lot: 20 shares

Minimum Quantity: 20 shares

Download the RHP (Red Herring Prospectus) here.

Conclusion:

The company’s success has been primarily attributed to professionalism and transparency. It has successfully established in the real estate sector after starting as a civil engineering contractor. The track record of the company in executing the projects is exceptional. At the offer price of Rs.265 – Rs. 310, the P/E ratio is 18 to 20 times the company’s consolidated earnings for 2006 - 07 on the expanded equity base. The offer is at a discount to companies of a similar size in the real estate sector.

Some of its major competitors are concentrated in and around Delhi like DLF, Unitech etc. So this company faces tough challenges since they have to compete with better known players. It also has relatively lesser experience in this field than their main competitors.

Investment can be considered in the IPO with a long term perspective.