Showing posts with label PURAVANKARA PROJECTS. Show all posts

Sunday, October 7, 2007

Review of select real estate sector stocks

The India Street previously analyzed the following IPO’s:

These stocks have been listed and we had discussed in my previous article, “How do IPO’s fare in Secondary Market?” about how IPO stocks are received by the market particpants. Some stocks perform exceptionally well and some others get discarded by the crowd.

In this article, let us discuss the short term perspective of the five stocks mentioned above using daily charts.

Summary:

Scrip

IPO Price

Price 05-Oct

% return

DLF

525

851.10

62.11

HDIL

500

722.20

44.44

IVRPRIME

550

441.30

(19.76)

OMAXE

310

317.40

2.39

PURVA

400

460.45

15.11

We indicated that IVR Prime might be avoided in the short term. It may be noted that Puravankara had extended the IPO subscription period by five days and also reduced the price band from 500 – 525 to 400 – 450 per share. This happened at a time when the “US Sub-prime mortgage crisis” was being cited as the reason for stock market collapse.

The following table gives the BSE Group/Scrip codes for the stocks.

NSE Symbol

BSE Group

Scrip Code

DLF

A

532868

HDIL

A

532873

IVRPRIME

A

532881

OMAXE

A

532880

PURVA

A

532891

DLF:

The stock got listed on July 5. On August 13, it touched a low of 490, 35 less than its IPO price (See chart below).

The long lower shadow when it broke the support indicates that there was lot of buying support at lower levels. Technically, it broke its short term resistance on September 19 with an upward gap. On October 3, it managed to touch a high of 904, gaining 16.38%. If we consider 100% retracement from the low of 490, the target for this upmove works out to 980.

On October 3, the BSE had made an announcement that “the Company has been awarded the project to develop a ‘New Bangalore City’ in Bidadi following a global tender issued by Bangalore Metropolitan Regional Development Authority (BMRDA). The project shall generate value in excess of Rs. 50,000 crore (USD 12.5 billion), which is the single largest investment in real estate in India.”

It may be noted that the ‘news’ arrived in the marketplace nearly two weeks after it had broken its resistance. This is a good example of how the stock market works.

HDIL:

This stock too, had gone below its IPO price of Rs.500 on August 6 after getting listed on July 24. Interesting to note that it touched a high of 634.30 on July 26.

The stock recorded a low of 477.50 on August 22. At the time of the so called US Sub-prime mortgage crisis, this stock closed below its IPO price on 4 occasions – only to bounce back. Similar to DLF, the stock had broken its resistance on September 19 with an upward gap.

A bullish “harami” candlestick pattern was formed on September 26. On October 4, the stock had closed at 707.15, gaining 6.42%. There seems to be some more upside left, as the technical target from the low of 477.50 works out to be 773.

IVR Prime:

We gave the following reasons for avoiding the IPO in the short term.

  • Issue was slightly overpriced compared to others.
  • Except the Gachibowli project in Hyderabad, IVR Prime has not executed any other project; others are in planning stage.
  • The company owns only 14% of its projected 2,478 acres land bank.

On the day of listing i.e. August 16 the stock made a high of 495, 55 less than the IPO price. This is the critical resistance for the stock. On August 23 the stock made a low of 343. Though the stock closed above 425 on September 24, it registered a lower low of 358 on September 27. This violates the Elliot wave theory. Though 343 still remains intact, formation of a lower low during an uptrend indicates that a reversal is likely to follow.

Unless this stock closes above 495 with reasonably good volumes, one should not expect any upside from the stock. The market has endorsed The India Street’s view on the IPO.

Omaxe:

The stock opened at 410 on August 9 with a premium of Rs.100. It touched a high of 448 before closing at 349.35. However, it opened with a huge downward gap of 13.90 on August 16. On August 22 it touched a low of 263.15.

It can be seen from the above chart that wave 1 is complete and wave 2 is in progress. The stock faced resistance around 355.70 (50% retracement level) and it closed above it for 2 days in a row. With the current trend it has support at 304.10 which is 61.8% retracement level. The stock needs to break its resistance at 369.95 on a close basis in order to move upwards.

Puravankara Projects:

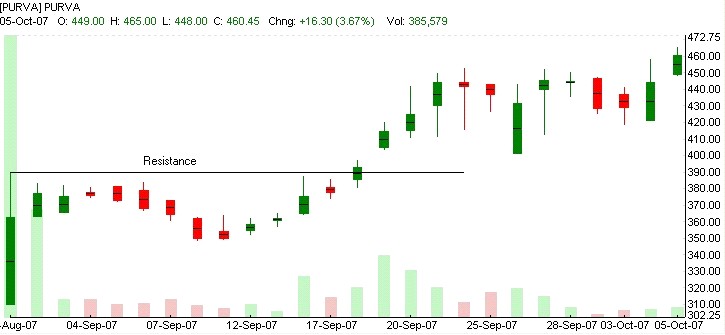
The stock opened with a negative premium of Rs.90 (IPO price: Rs.400) on August 30. It has been the lowest till today. After 13 trading sessions, it broke its previous high of 390 (made on day of listing) on September 18. On October 5 it closed above 452.50, a high made on September 24. The short term target works out to 501.60 when calculated from a low of 310.
Friday, August 31, 2007

India Stock Market – Monthly Review for August 2007

Indices witness non stop rally; The India Street Analysis proved right!

A couple of weeks ago, there were some ‘worries’ about how Indian stock market is likely to perform in the near future. Reasons cited were:

In the last week’s review, we had indicated that the indices appeared to have bottomed out. We gave 3 reasons to believe so.

  • Solid buying support came in after every fall
  • A bullish ‘harami’ candlestick pattern in weekly chart with medium reliability
  • Decreasing price and open interest in August contracts of Nifty futures

Those who were skeptical about Technical Analysis may have found out what exactly was reality.

Indeed, the indices DID bottom out. This week, the Nifty gained 273.85 points or 6.54% on a weekly close basis. In the last one year, it gained 5% or more only once during the week ended March 23, 2007. This week’s gain is only 7th such occasion in the last 3 years. That way, this week has been quite a remarkable turnaround in Indian stock markets.

The following table summarizes the daily gains of Nifty during the week.

Date

Points Gained

% Gain

27-Aug-07

112.45

2.68

28-Aug-07

18.10

0.42

29-Aug-07

38.60

0.89

30-Aug-07

53.00

1.22

31-Aug-07

51.70

1.17

It can be seen that Nifty didn’t lose a single point throughout this week.

Let’s now discuss the daily chart of Nifty.

The index has completed one full Elliott wave cycle as can be seen from the above chart. Waves 1 – 5 and a – c are already over. To begin a fresh cycle, the index needs to make a higher high and a higher low.

In the chart shown below, Fibonacci retracements are displayed. Nifty has successfully closed above 4401 i.e. 61.8% retracement which is the technical recovery target.

On August 27, a “Three outside up” pattern was formed in the daily chart of Nifty. Though the shadows of red candle were not engulfed by the shadows of the green candle, it is still a pattern with a lesser reliability. The green candle on Monday had a partial upward gap and this confirmed the engulfing pattern formation.

In the weekly chart, a bullish “Three inside up” pattern has been formed as shown below.

The bullish pattern in weekly chart confirms the reversal. But in monthly chart, a bearish “Harami” pattern has been formed. Watch the long lower shadow. This is an indication of the lower side volatility. Previously, a bearish “Engulfing” pattern was formed as shown. But these two candlestick patterns need confirmation on the third period (day, week or month). Without confirmation, the patterns are insignificant.

Forecast for the next week:

Now that we have confirmation of reversal in short and medium term charts, we need to look for the formation of first wave in daily chart i.e. a higher high and a higher low. The index is likely to face resistance at 4530 and ideally, a close above 4530 will complete the formation of first wave.

Even if that does not happen, 38.2% and 61.8% retracement levels should hold. Considering a low of 4002 and a high of 4471 these levels work out to 4293 and 4183 respectively. So, if a correction in the index starts straightaway next week (since the index gained for six consecutive days in a row) these are the two levels to watch out for. A reversal should occur after any of these retracements are breached.

We still remain positive on Indian stock market. Any decline in the index next week will only be an opportunity to enter the Nifty futures.

Futures & Options Market:

It can be seen that the price and open interest are increasing for the September contracts for Nifty futures. This again, is a bullish sign, meaning more buyers enter the market as price increases.

IPO Update:

The India Street analyzed Puravankara Projects Limited IPO. Its issue price was Rs.400. It got listed on August 30. It opened with a negative premium of Rs.90 at Rs.310 and closed at Rs.362.30. However, today it gained slightly to close at Rs.377.05.

For the top 10 gainers and losers in the overall market for this month please read my earlier article, “India’s hottest stocks for August 2007”.

The top 5 gainers and losers for the month among index stocks are given below.

Scrip

% Gain

Scrip

% Loss

SAIL

12.01

CIPLA

12.75

BHEL

9.29

VSNL

12.01

TATASTEEL

5.10

HINDPETRO

8.79

RPL

3.63

GAIL

8.38

RELIANCE

3.56

TCS

7.95

The India Street analyzed BHEL in “Stock of the week: Bharat Heavy Electricals Limited” and VSNL in “Stock of the week: Videsh Sanchar Nigam Limited VSNL”. We discussed about CIPLA in my previous article, “5 More Stocks to Avoid in the Short Term”.

Our long term pick Nagarjuna Fertilizers Limited gained 72.49% this month. Our short term pick Tata Sponge Iron Limited gained 20.84% this month.


Friday, August 10, 2007

India Stock Market – Weekly Review

Correction in Nifty continues; clear picture may emerge next week

In the last week’s review we discussed about “harami” candlestick pattern and it could be a confusing signal unless confirmed by a green candle and positive close above 4530. For this to happen, the index had to gain about 128 points, preferably with a full upward gap or even a partial upward gap. I had also mentioned that it didn’t seem to be a possibility since bulls were losing momentum on Friday.

As expected, confirmation couldn’t be achieved on Monday, as the market lost 62.05 points. However the bulls were seen in action on Tuesday as the market gained 16.85 points. But it formed an “inverted hammer” meaning the index was brought back near its opening price due to sell off at higher levels. On Wednesday the bulls were in perfect control; the Nifty gained 105.75 points. Again, a “three inside up pattern” was formed. The index achieved a high of 4530 on Thursday before collapsing once again by 58.90 points. So 4530 has acted as a strong resistance for the index. On Friday the market was deep in red with the index losing 164 points at one stage. However, the afternoon session saw bulls coming back once again. Nifty had lost 69.85 points today. On weekly basis the index has lost 68.20 points or about 1.55%.

In the daily chart of Nifty, we can see the “Three inside up” pattern (“Harami” followed by a green candle and higher close). Since the bulls failed to cross 4530 and after yet another fall, we have to maintain 4218 as the next support level.

Now that the index has closed below 4363 on Monday/Tuesday as well as today this should act as a minor resistance when Nifty reverses. Let us discuss the Fibonacci retracements as shown below.

It can be seen that 4310 (61.8% retracement level) has not yet been breached on a close basis, though low went below it on a couple of occasions. A close below this level would mean that when index reverses, it may find difficult to break its resistances and the trend may not be strong.

The intraday chart of Nifty for Thursday is been shown below. On Thursday bulls lost control in the afternoon while today they were back in action after 2 pm. Thursday’s quick fall meant that the market had a strong negative opening today. The bulls have managed to break intraday resistance and this could be positive for next week.

Today’s intraday chart is given below:

Intraday charts courtesy: NSE

Forecast for next week:

In all probability the market should recover and reverse in the coming week. We saw a strong lower side volatility and intraday resistance breakout today. At market tops and bottoms, volatility will be very high. So the level of 4310 needs to be watched on a close basis. A close below this will make the index more sluggish during pullback rally. A close above 4530 will mark the return of bulls and the market will be ready for further uptrend.

Advance / Decline Ratio:

Date

Adv.

Dec.

Unch.

06-Aug-07

314

790

24

07-Aug-07

724

369

31

08-Aug-07

841

258

31

09-Aug-07

268

843

24

10-Aug-07

309

799

26

This leads to an overall advance % of 43.46, decline % of 54.13 and unchanged % of 2.41% for the week.

Top Gainers / Losers among Index stocks:

Scrip

% Gain

Scrip

% Loss

HCLTECH

6.82

VSNL

8.57

GLAXO

5.74

HINDALC0

6.98

TCS

4.34

STER

5.86

SUZLON

4.28

ICICIBANK

5.61

BPCL

2.30

GAIL

5.10

Top Gainers / Losers in overall market:

Scrip

% Gain

Scrip

% Loss

ETCNET

92.71

ABGSHIP

17.63

CONSOFINVT

40.03

LOKESHMACH

11.45

ORBITCORP

37.79

IBREALEST

11.11

RUCHIRA

29.92

RENUKA

10.91

JAICORPLTD

27.63

GREAVESCOT

10.37

Please note that only ‘A’ group and ‘B1’ group stocks of Bombay Stock Exchange (BSE) are considered for the above table.

ETC Network is a case of bear trap. Orbit Corporation was The India Street short term pick. From 272.70 on June 29 it has appreciated to 504.30 today (85%). We discussed about Indiabulls Real Estate in “Technical review of select India stocks for medium term” and Shree Renuka Sugars in “How do IPO’s fare in Secondary Market?”.

The India Street analyzed Puravankara Projects Limited IPO. The issue closed on August 8 after the price band was revised to Rs.400/- to Rs.450/- per share. It got oversubscribed by 1.91 times. Qualified Institutional buyers oversubscribed the issue by 2.69 times, high networth individuals by 0.99 times and retail investors by 0.64 times. Omaxe got listed on August 9. It was issued for Rs.310. It opened with a premium of Rs.100 at Rs.410. It reached a high of 448 after listing. However, it couldn’t sustain selling pressure at higher levels and closed today at 345.75.

Our short term pick India Glycols closed at 184.80 on August 8, gaining 12.55% since our analysis on July 18. Long term pick Nagarjuna Fertilizers gained about 13.20% this week. Apart from these there are no other major movers among our short, medium or long term picks.

Saturday, August 4, 2007

Weekly Stock Review and Price Correction May Continue Next Week

Index moves as anticipated; some more downside likely

The Hindu reported on August 2 about the fall in the index like this:

“In a major shake-up on stock exchanges, the benchmark Sensex lost 615.22 points to end below the 15000-mark. The meltdown in the Indian stock prices on Wednesday was attributed to negative news flow on sub-prime mortgage — which related to realty markets — worries from the U.S. While Asian markets witnessed a sharp fall in their indices, India’s Realty index was the worst hit, which was down by over 6.64 per cent and selling was seen in scrips across sectors.”

We can understand the fall in realty index and real estate stocks as a result of US events, but why there should be across the board selling in other sectors?

This is what The India Street analysis said about index:

Review dated July 20:

“…This means that the market is witnessing profit booking at higher levels. Going by this chart, we may see further corrections next week. But those corrections will be good for the index and the overall market.”

Review dated July 28:

“…The index has just managed to break the 38.2% retracement from 4648 today at 4438 but managed to close above it. 61.8% retracement works out to 4309. It falls below the first support 4363 and should be the downside target for this correction.”

Nifty had lost 174.60 points last Friday (July 27). On Monday (July 30) we saw a near flat trading session which lost 5.15 points. A red candle with a doji body appeared yet again. We discussed this doji body in our weekly review dated July 20 and monthly review dated July 28. On Tuesday index went up by 88.80 points. Nifty fell by 183 points on Wednesday. Thursday’s trading session witnessed a green candle and a doji body, gaining 10.50 points. Today the index once again went up by 45.20 points.

Overall, Nifty lost 43.65 points or 0.98% this week. The daily chart of nifty is displayed below.

When the two green candles of Thursday and Friday are superimposed we get a green candle as shown in the box. This leads to “Harami” candlestick pattern. Harami means pregnant and the Japanese view this as a confusing signal though it is a bullish pattern. This pattern needs to be confirmed by a green candle on Monday preferably with an upward gap opening and a close above 4530. For this to happen, the index needs to gain at least 128 points. But the intraday chart of August 3 shows that the bulls were losing momentum right through the trading session.

Chart courtesy: NSE

It can be seen that the market opened on positive note but gradual selling occurred during the day and the index failed to break its intraday resistance.

As I mentioned last week, nifty touched an intra week low of 4327 on Thursday, just 18 points more than the target of 4309 and it has managed to bounce back.

Forecast for next week:

If the index manages to close above 4530 with a green candle (either full upward gap or even a partial upward gap) on Monday, we can confirm that the ongoing correction is over and the market will resume its uptrend.

Going by the intraday chart on Friday, this doesn’t seem to be a possibility. In that case, market may witness some more correction. However, 4363 and 4245 are the support levels between which the index should reverse.

The short sellers need to be cautious since the nifty has not yet broken the short term supports and medium/long term trend is still bullish.

Advance / Decline Ratio:

Date

Adv.

Dec.

Unch.

30-Jul-07

517

581

27

31-Jul-07

779

325

19

01-Aug-07

75

1043

10

02-Aug-07

592

508

30

03-Aug-07

736

370

27

This leads to an overall advance % of 47.87, decline % of 50.13 and unchanged % of 2.00% for the week.

Top Gainers / Losers among Index stocks:

Scrip

% Gain

Scrip

% Loss

SBIN

9.14

M&M

13.04

HDFC

4.30

NATIONALUM

11.24

LT

4.13

TATAMOTORS

6.12

BHEL

3.75

HINDALC0

6.07

GRASIM

3.54

ZEEL

5.58

Top Gainers / Losers in overall market:

Scrip

% Gain

Scrip

% Loss

TIPSINDSLTD

38.96

CANDC

20.66

JINDALPOLY

28.48

KOTHARIPRO

18.33

JAICORPLTD

27.63

VENKEYS

17.55

VOLTAMP

27.30

AXIS-IT&T

16.61

JINDALPHOT

25.74

SHAHALLOYS

15.87

The India Street analyzed Puravankara Projects Limited IPO. The issue was to close on August 3 and it received a very poor response. Bids for 7.6 million shares were received till 1700 hours on Friday, for an issue size of 21.47 million shares (36% subscription). This is attributed to the negative news on the realty index and real estate sector.

The Book Running Lead Manager to the issue has informed the National Stock Exchange that the issue will close on August 8, 2007 instead of the earlier closing day of August 3, 2007. Further, price band has revised from Rs.500/- to 525/- per share to Rs.400/- to Rs.450/- per share.

Everonn Systems India Limited got listed with a big bang on August 1. Its issue price was Rs.140. However it opened with a premium of Rs.105 at Rs.245, reaching a high of Rs.567 on the day of listing. It closed at Rs.474.25 on August 3.

Realty Index:

Chart courtesy: BSE

The daily chart of BSE realty index is shown above. Watch the upward and downward gaps in the chart. The downward gap indicates that there would be some sell off, as it was confirmed on August 1. So it didn’t come as a surprise. Same principle is applicable for the upward gap too.

Saturday, July 28, 2007

Puravankara Projects IPO – The India Street Analysis

Puravankara Projects Limited

Summary

The Issue: With so many real estate IPO’s entering the capital market will there be reasonable returns from this stock in long term?

The Solution: Hopefully yes. This company is backed by decent financials, good experience and strong marketing network.

Puravankara Projects Limited is a Bangalore based real estate developer company with more than 30 years of presence in Mumbai, Bangalore, Kochi, Chennai, Coimbatore, Hyderabad, Mysore, Colombo and the United Arab Emirates (U.A.E). Its public issue opens July 31, 2007 and closes on August 3, 2007.

Business Overview:

The operations of the company include identification/acquisition of land, planning, executing and marketing of real estate projects. Both residential and commercial projects are executed. Residential projects consist of apartment complexes, villas and townhouses while commercial projects include retail and office premises.

The company was originally incorporated as Puravankara Constructions Private Limited in 1986 at Mumbai. In 1992 it was made a public limited company and the name was changed as Puravankara Projects Limited.

The total land area available is 38.07 million square foot, developable area is 116.24 million square foot and saleable area is 106.80 million square foot.

The company’s real estate development is concentrated primarily in southern India i.e. Bangalore, Chennai and Kochi. It has also acquired roughly 1.06 million square foot of land in Colombo for luxury residential project consisting of independent villas and townhouses.

The list of completed projects so far is given below:

At Mumbai:

Project Name

Saleable area

Uran Park, Mora Road

0.02

At Bangalore:

Project Name

Saleable area

Purva Park, Cox Town

0.50

Castlemaine, Jayamahal Road

0.02

Purva Nest, Cambridge Road

0.01

Purva Graces, Yelahanka

0.17

Purva Iris, Cox Town

0.06

Purva Heights, Bannerghatta Road

0.35

Purva Paradise, Domlur

0.05

Purva Fairmont, Koramangala

0.41

Purva Pavilion, Hebbal

0.24

Purva Parkridge, Marathahalli

0.35

Purva Carnation, Cox Town

0.08

Whitefield Bouganvilla

0.07

Purva Riviera, Marathahalli

1.26

Saleable area is in million square foot.

The company has also completed a commercial project, The Pavilion, on M.G. Road, Bangalore and it is ready for occupation. One more commercial project is being undertaken at Chennai with a saleable area of 0.35 million square foot.

There are 4 residential projects currently under execution at Bangalore on land that is owned by the company with a saleable area of 6.41 million square foot. These are Purva Grande (Lavelle Road), Purva Fountainsquare (Marathalli Junction), Purva Venezia (Yelehanka) and Purva Highlands (Kanakapura Road).

Similarly there are two ongoing projects at Chennai. These are Purva Swanlake (Old Mahabalipuram Road), Purva Jade (Arcot Road) with a total saleable area of 0.92 million square foot. In addition, at Kochi, there are three more projects currently in progress. These are Purva Grand Bay (Marine Drive), Purva Eternity (Kakkanad), Purva Moonreach (Airport Road) with saleable area of 1.86 million square foot.

The company also executes 5 more projects at Bangalore on joint development basis with a total saleable area of 1.44 million square foot.

A view of the Purva Fairmont, HSR Layout, Koramangala, Bangalore

The company has entered into a joint venture (Keppel Puravankara Projects Private Limited) with Keppel Investment Mauritius Private Limited, a subsidiary of the Singapore based Keppel Land Limited. Elita Promenade, a residential project in Bangalore, is being executed with a saleable area of 1.22 million square foot by this joint venture.

Through its IPO the company plans to mobilize Rs.1,125 crores at the upper price band of Rs.525, which shall broadly be used for repayment of loan of Rs.420 crores and Rs.351 crores for acquiring 43.56 million square foot land in and around Sriperumbudur and Kancheepuram near Chennai. After the IPO promotors shall have 89.95% stake in the company.

Financial data:

Item

2003

2004

2005

Income

41.35

76.38

151.03

Expenditure

32.29

59.94

110.60

Profit before tax

9.06

16.44

40.43

Net profit

6.49

15.44

38.02

Item

2006

2007

Income

280.42

416.86

Expenditure

197.81

284.53

Profit before tax

82.61

132.33

Net profit

73.45

130.40

All figures in Rs. Crores.

Comparison with some listed companies:

Company

EPS

P/E

Book value

BLKASHYAP

43.80

35.00

237.80

PENINLAND

57.00

8.60

104.80

ANSAL **

9.40

29.90

80.50

PURVA **

6.80

77.20 *

11.50

* At the upper price band.

** Face value of Ansal and Puravankara is Rs.5.

IPO Details:

Issue Period: July 31, 2007 to August 03, 2007

Issue Size: 21,467,610 Equity Shares

Face Value: Rs. 5

Price Band: Rs. 500 to Rs. 525

Market Lot: 10 shares

Minimum Quantity: 10 shares

Retail Investor Limit: Rs.100,000

Click here to download application form.

Click here for Red Herring Prospectus.

Conclusion:

Puravankara has a strong presence in southern India, where lot of IT companies have set up their operations. After Sobha Developers, Puravankara is the second Bangalore based realty major to enter the capital markets. The company sells the real estate properties directly to the customers with marketing offices in India and UAE. The strong marketing network will help the company to reach the large NRI population in Gulf countries.

Puravanakara has the industry experience and technical expertise. Moreover, it owns nearly 43% of the developable land which gives a distinct advantage.

At the upper price band Rs.525, EPS of 6.80 and P/E of 77.20, the stock may be slightly expensive but there seems to be some considerable upside, based the growing demand in real estate industry and company’s ongoing / proposed projects.